
The service catalog lists every service that sends telemetry to a project. Nothing needs to be set up: a service appears a few minutes after its first logs, traces or metrics arrive, across every environment of the project, and it leaves once all its data has aged out. The catalog is read-only. Services can’t be created, edited or deleted by hand.
Each service has an ID, an svc_ slug and a resource name like any other resource. Its request
rate, error rate and latency come from the span metrics
Observability generates from its traces, and its callers and callees come from the
service map.
How services are named
A service is identified by its key, built from two resource attributes:
| Resource attributes | Key |
|---|---|
service.name=checkout |
checkout |
service.name=api, service.namespace=payments |
payments/api |
No service.name |
unknown_service, or <namespace>/unknown_service with a namespace |
- The key is the same value as the
joblabel of the service’s metrics and theservicelabel of its span metrics, so one name works in the catalog, in PromQL and in Grafana. - One key is one service in the whole project. The same key sent to
productionandstagingis one service seen in two environments. - Keys are kept exactly as sent: they’re case-sensitive, and spaces aren’t trimmed.
Checkoutandcheckoutare two services. (Environment and application names, by contrast, are lowercased.) - OpenTelemetry SDKs send
unknown_service:<process name>whenservice.nameisn’t set. That’s cataloged as sent. A resource with noservice.nameat all is cataloged asunknown_service, which the console shows as Not set (payments/unknown_servicewith a namespace, shown as sent). - The key’s parts are split at its last
/, so avoid/inservice.nameitself. - Keys starting with
ezgh.are reserved for series Observability generates (such asezgh.servicegraph). Data sent with such a key is stored, but the service isn’t cataloged. - A key longer than 255 bytes, or one with control characters, isn’t cataloged either, and its spans generate no span metrics. Its data is still stored.
Set service.namespace
Use service.namespace to group the services of one team or system, and to keep two services
with the same service.name apart:
OTEL_RESOURCE_ATTRIBUTES="service.name=api,service.namespace=payments,ezgh.metadata.application=storefront,ezgh.metadata.environment=production"Changing a service’s service.name or service.namespace makes it a new service. The old one
stays in the catalog, marked inactive after 7 days, until its data ages out.
What the catalog shows
Everything about a service comes from its telemetry:
| Field | From |
|---|---|
| Environments | The datasets it sent data to, with the signals (logs, traces, metrics) and when each was first and last seen |
| Applications | The ezgh.metadata.application values it sent; unknown isn’t listed |
| Latest version | Per environment, the most recently seen service.version |
| Versions | Per environment, every service.version with when it was first and last seen; the newest 100 are kept |
| Languages | telemetry.sdk.language, such as java or python |
| First seen, last seen | Its first and latest data, on any signal and in any environment |
| Active | Whether it sent anything in the last 7 days |
A version or language longer than 128 bytes isn’t kept.
Discovery takes a few minutes: a new service, a new environment or a new version shows up about 2 to 4 minutes after its data arrives, and last-seen times are just as far behind. Request stats come from span metrics, which follow the spans by about a minute.
Services that last sent data before the service catalog was available aren’t listed, and a service’s first-seen time is never earlier than that.
In the console
Open Observability > Services.
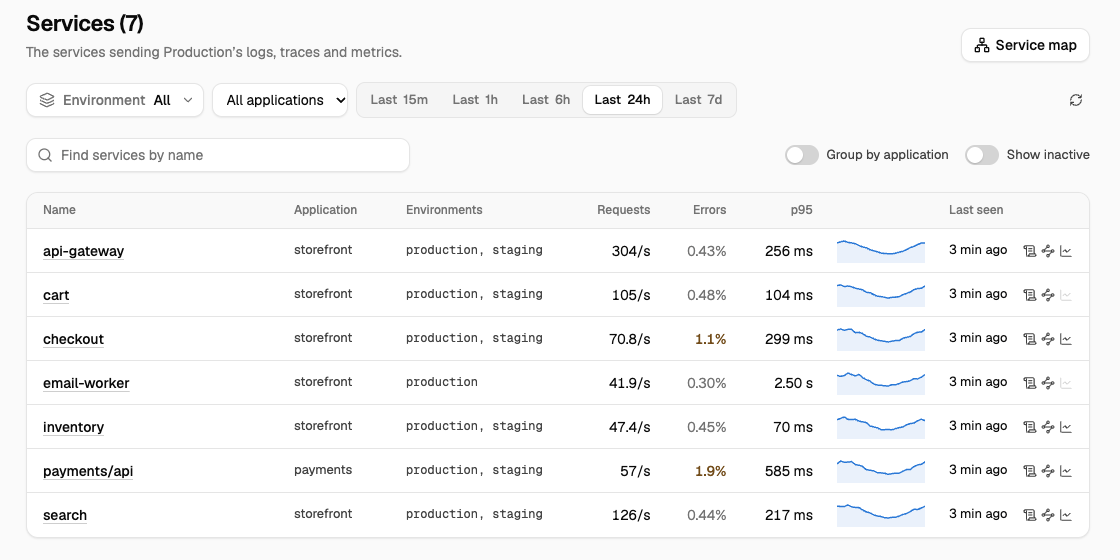
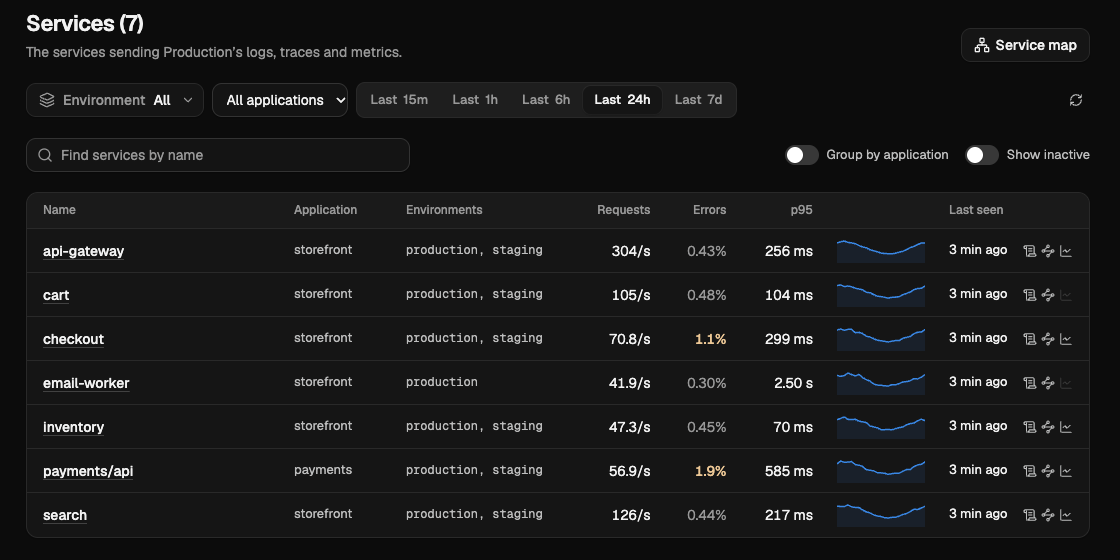
- The list shows each active service’s application, environments, requests per second, error rate and p95 latency over the time range, a trend, and when it was last seen, with a mark for each signal it sends. Filter by environment (or all of them) and application, find services by name, turn on Group by application, and turn on Show inactive to include services not seen for 7 days. The filters are in the URL, so a filtered list can be shared.
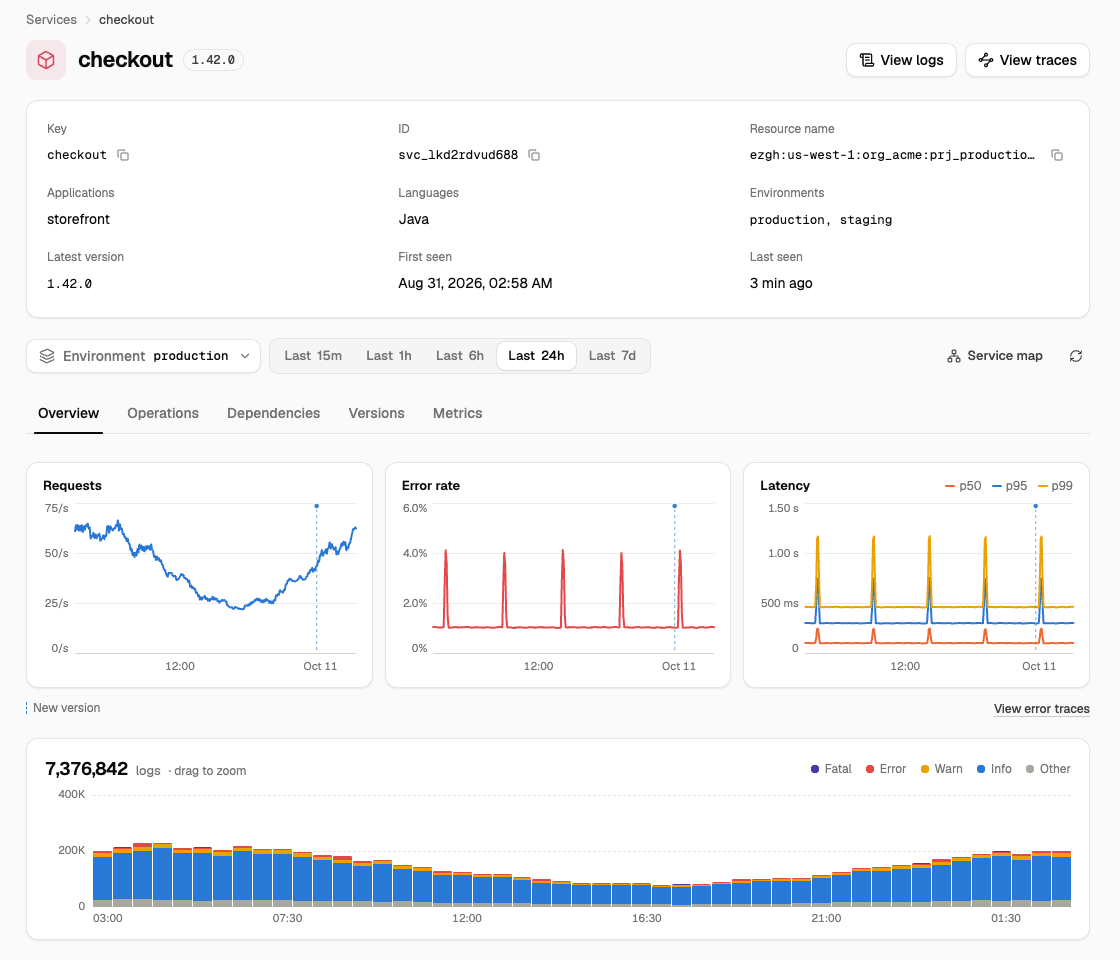
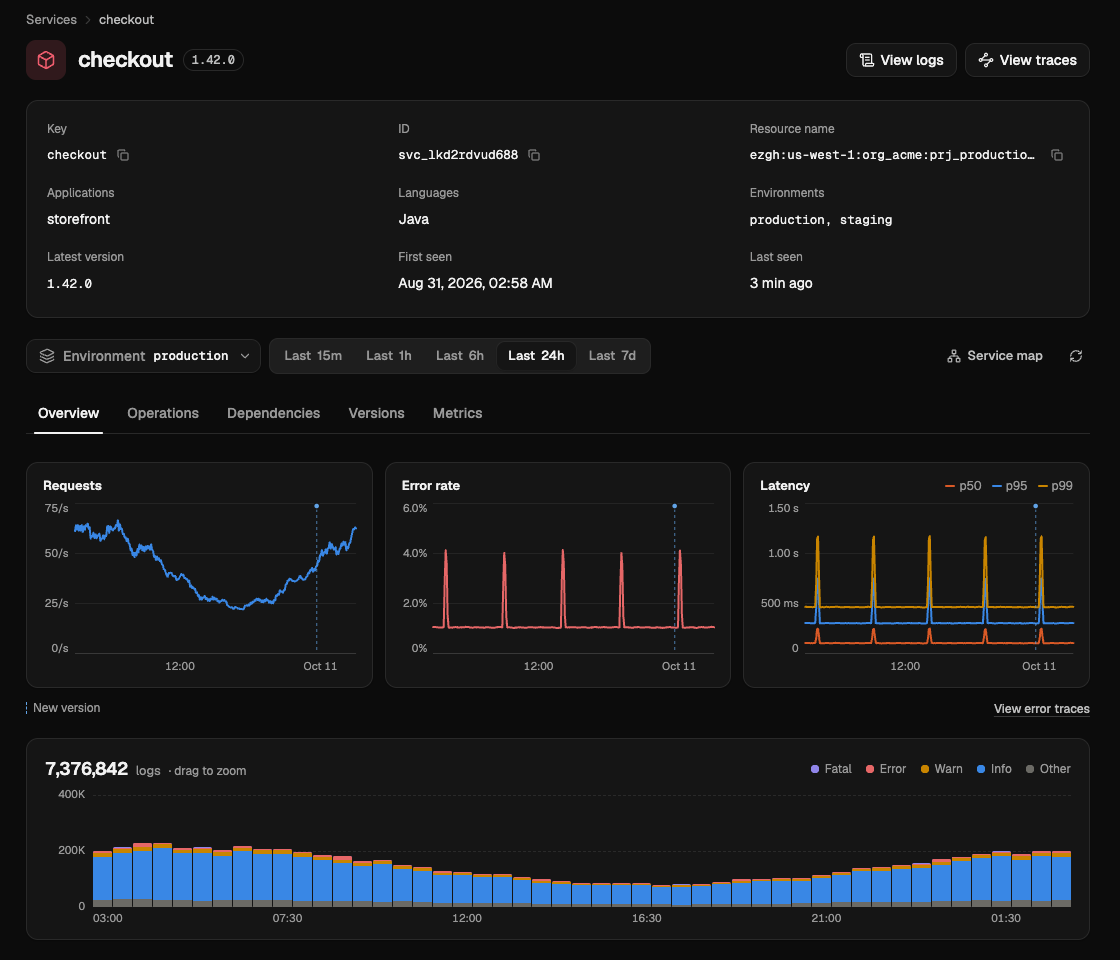
- A service’s page has its key, ID, resource name, applications, languages, environments, latest version, and first and last seen, with View logs and View traces for its data. Pick an environment (the most recently seen one by default) or All environments, then a tab. Log volume and versions need one environment.
| Tab | Shows |
|---|---|
| Overview | Requests per second, error rate and p50, p95 and p99 latency over time, with new versions marked; log volume by severity; View error traces |
| Operations | Each span name and kind with its requests, errors and latency, ranked by its share of the time spent in the service. A row opens its traces. |
| Dependencies | Called by and Calls: the services, databases, queues, external hosts and users it talks to, with each one’s requests, errors and p95 |
| Versions | The versions it reported in the environment, newest first |
| Metrics | The metric names with job equal to its key: those it sends and its span metrics (marked Span metrics), each opening in Metrics |
- Requests are spans of kind server and consumer: the requests and messages a service receives. A service with none, such as a worker or a scheduled job, shows No inbound requests; its Operations tab covers every span kind.
- A service that sends no traces in the environment shows No traces: it’s listed from its logs and metrics, without request stats.
- The stats are PromQL queries over span metrics and need
obs.metrics.query. Without it, the list and pages say so once and still show the services.
Service map opens the service map for the same environment and time range.
From the CLI and the API
ezgh obs services list --project web
ezgh obs services list --environment production --stats --from 6h --project web
ezgh obs services get payments/api --project web
ezgh obs services versions payments/api --environment production --project web
ezgh obs services deps payments/api --environment production --from 24h --project webget, versions and deps take a service’s exact key, its ID or its svc_ slug. list shows
active services; --active all includes inactive ones and --active false shows only those.
--stats adds requests per second, error rate and p95 latency over --from and --to. deps
lists what calls the service and what it calls, from the service map. -o json prints the
API’s answer. See ezgh obs services.
The services are under the project’s Observability API:
| Operation | Request |
|---|---|
| ListServices | GET /v1/organizations/<organization ID>/projects/<project ID>/obs/services |
| GetService | GET …/obs/services/<service ID> |
| ListServiceVersions | GET …/obs/services/<service ID>/versions?environment=production |
ListServicesreturns{ "services": […], "nextCursor": …, "capReached": … }, ordered by key. Filters:q(part of the key or name, ignoring case),key(an exact key),environment,applicationandactive(true, the default;false; orall).limitis 1 to 100 (default 20), andcursortakesnextCursorfor the next page.capReachedistruewhen the project has reached its services quota.- A service has the common resource fields (
id,slug,name,resourceName,organizationId,projectId,region,status,createdAt,updatedAt), pluskey,serviceName,serviceNamespace(nullwithout a namespace),active,firstSeenAt,lastSeenAt,applications,languagesandenvironments. Each environment is{ "environment", "datasetId", "latestVersion", "signals" }, wheresignalshas a{ "firstSeenAt", "lastSeenAt" }for each oflogs,tracesandmetricsthe service sent there. GetServicetakes the service’s ID. To find a service by key, list withkey.ListServiceVersionsrequiresenvironmentand returns{ "versions": [{ "version", "firstSeenAt", "lastSeenAt" }], "nextCursor" }, newest first.- An ID that isn’t one of the project’s services is
404. Viewing a service withoutobs.services.geton it is403.
Request stats and dependencies are PromQL over span metrics, through the project’s Prometheus API; see Span metrics for the queries.
When services are removed
There’s no way to delete a service. It’s removed automatically once none of its data is left:
- Each environment and signal it was seen on expires when the dataset’s retention for that signal has passed since it was last seen there. Traces count the dataset’s metrics retention too when it’s longer, because the span metrics generated from them are kept that long (13 months by default).
- Once a day, services with nothing left are removed, together with their versions.
- When a dataset is deleted, the service’s environment is removed with it, and a service seen only in that dataset is removed.
Until then, a service not seen for 7 days is inactive and hidden from the default list. Removing a service gives back its place in the quota.
Limits
| Quota ID | Name | Scope | Default | Adjustable |
|---|---|---|---|---|
obs.services.perProject |
Services per project | Project | 1,000 | Yes, up to 5,000 |
When a project has reached its quota, new service keys aren’t cataloged: their data is still
stored and their span metrics are still generated, but they aren’t listed. The list says so
(capReached in the API), and the console links to the quota. A key that wasn’t cataloged is
added the next time it sends data while the project is under its quota.
ezgh quotas get obs.services.perProject --scope-key <project> shows the limit and usage; see
Service quotas.
Access
| Action | Allows |
|---|---|
obs.services.list |
Listing a project’s services |
obs.services.get |
Viewing a service and its versions |
ObsFullAccess, ObsReadOnlyAccess and ReadOnlyAccess include both. Request stats,
operations, dependencies and the service map read span metrics, which needs obs.metrics.query
on the environment’s dataset; the same three policies include it.
Trails
When the catalog adds a service, Trails records a CreateService event with
eventSource obs.ezghcloud.com and additionalEventData { "autoCreated": true }. Its
userIdentity is the ingest key that first sent the service’s data (type IngestKey, with the
key’s ID). When that key is no longer known, the event is a ServiceEvent by
obs.ezghcloud.com instead. A service that’s already cataloged, or that the quota keeps out,
records nothing.
Listing and viewing services aren’t recorded, and neither are the stats. Removing services when their data ages out or their dataset is deleted isn’t recorded.