
Trace sampling keeps or drops whole traces by rules you set on a dataset. Observability waits for a trace’s spans to arrive from every service, decides on all of them together (tail sampling), and stores only the traces it keeps. Only kept spans are counted in the traces meters.
- Nothing changes where you send from. SDKs, Collectors and the EZGH Obs Agent send every span, as they do without sampling. There’s no sampler to run and no trace-ID routing to set up.
- Traces only. Logs and metrics are stored as they arrive.
- Request stats still count every span. Span metrics, the service catalog’s stats and the service map count every span, kept or dropped.
- Off by default. A dataset without a policy, or with sampling turned off, keeps every trace.
Each dataset (one environment of a project) has its own policy, so production can sample while
staging keeps everything.
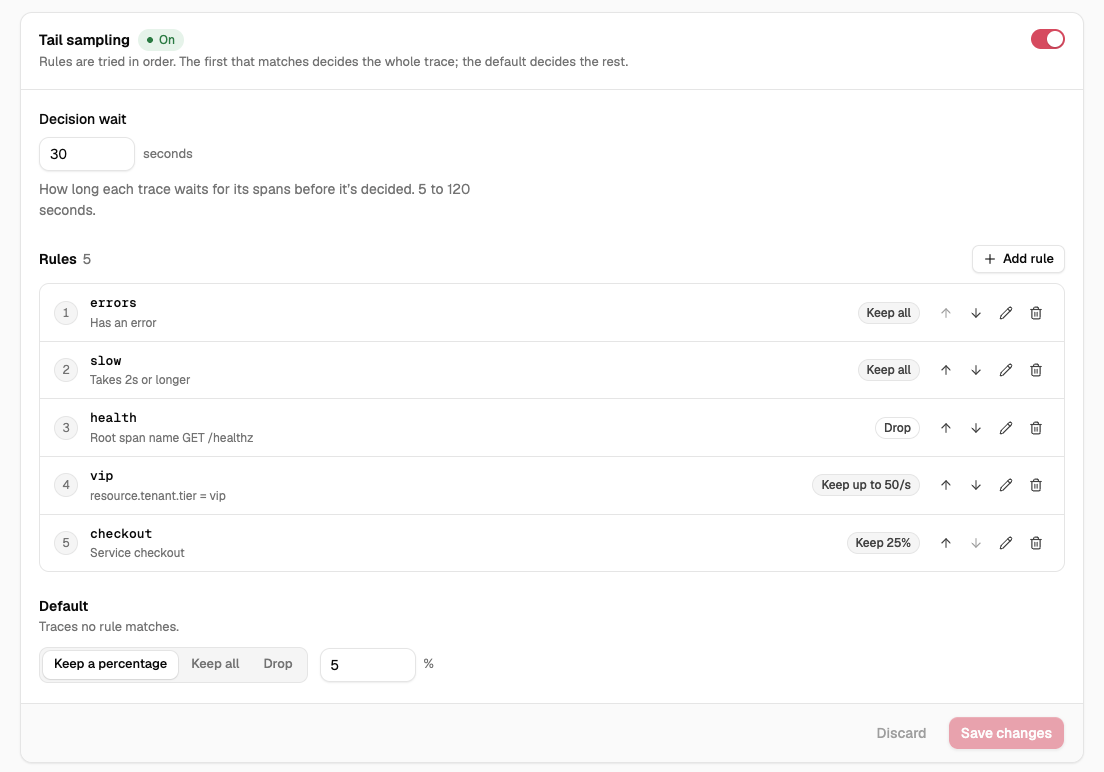
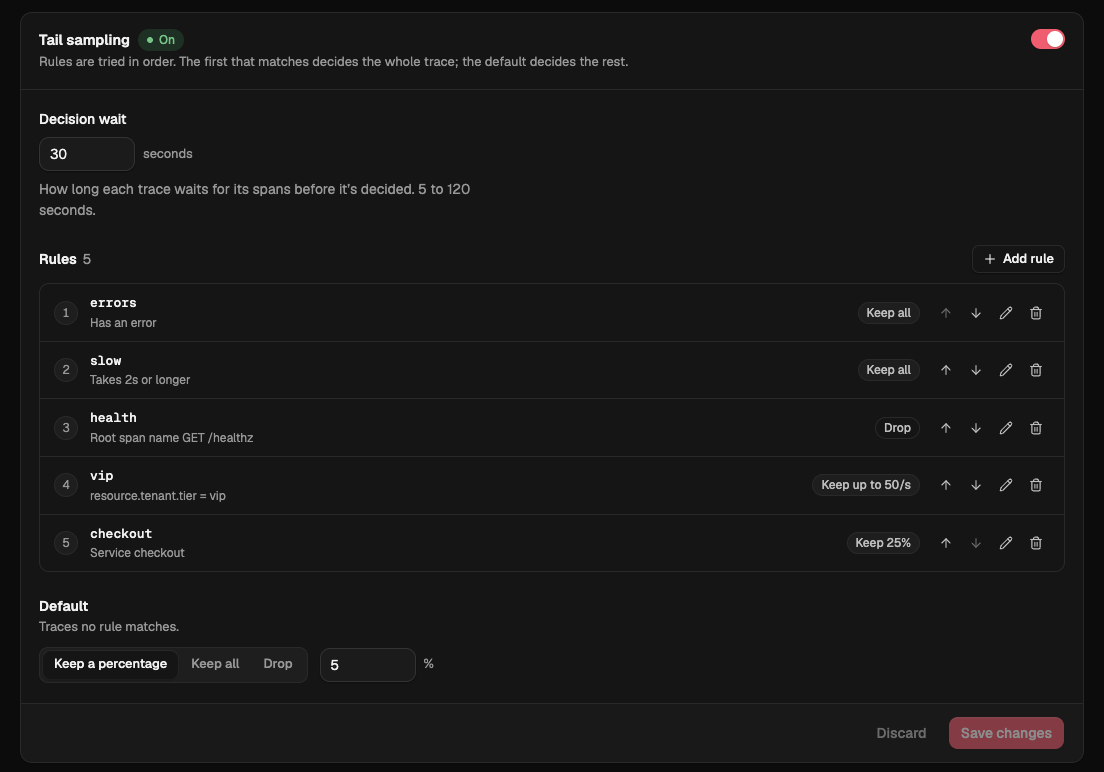
A policy
{
  "enabled": true,
  "decisionWait": "30s",
  "rules": [
    { "name": "errors",   "when": { "status": "error" },                         "keep": "all" },
    { "name": "slow",     "when": { "minDuration": "2s" },                       "keep": "all" },
    { "name": "health",   "when": { "root": true, "spanName": ["GET /healthz"] }, "keep": "none" },
    { "name": "vip",      "when": { "attributes": [{ "key": "tenant.tier", "scope": "resource", "equals": "vip" }] },
                          "keep": { "perSecond": 50 } },
    { "name": "checkout", "when": { "service": ["checkout"] },                   "keep": { "percent": 25 } }
  ],
  "default": { "percent": 5 }
}
This keeps every trace with an error and every trace of 2 seconds or more, drops health checks, keeps up to 50 traces a second from VIP tenants, a quarter of the checkout service’s traces, and 5% of everything else.
| Field | Value |
|---|---|
enabled |
true to sample, false to keep every trace. Required |
decisionWait |
How long a trace waits for its spans before it’s decided: 5s to 120s, 30s by default. Go duration syntax, such as 45s or 1m30s |
rules |
Up to 20 rules, tried in order. Each has a name, a when and a keep |
default |
What happens to traces no rule matches: "all", "none" or { "percent": p }. Required when enabled is true |
A rule’s name is 1 to 40 characters of a–z, 0–9, _ and -, starting with a letter
or digit, and unique in the policy. default is reserved for the policy’s default. Stats are
kept by rule name.
How a trace is decided
Rules are tried in order. The first rule that matches decides the whole trace: every span in
it is kept, or none is. When no rule matches, default decides.
A rule matches when every condition in its when holds. when is required; {} matches every
trace.
| Condition | Holds when |
|---|---|
"status": "error" |
At least one span has status error |
"minDuration": "2s" |
The trace lasts at least this long, from its earliest span’s start to its latest span’s end. More than 0s, at most 1h |
"service": ["checkout", "payments/api"] |
A span’s service key (service.namespace/service.name, or service.name) is in the list |
"spanName": ["GET /healthz"] |
A span’s name is in the list |
"attributes": [ … ] |
A span has every one of these attributes (up to 10) |
"root": true |
Narrows service, spanName and attributes to the trace’s root span, the one without a parent. On its own: the trace’s root span has arrived |
service,spanNameandattributesmust hold on one span."service": ["checkout"]with"spanName": ["POST /pay"]matches a trace with acheckoutspan namedPOST /pay, not one wherecheckoutandPOST /payare different spans.statusandminDurationare about the whole trace, with or withoutroot.- A trace whose root span hasn’t arrived doesn’t match a
rootrule. - Lists hold 1 to 50 values of up to 255 bytes each, matched exactly and case-sensitively.
An attribute filter is { "key", "scope", "equals" } or { "key", "scope", "exists": true }.
Unlike a span search’s filter, it has no op, and scope is
required: record for the span’s own attributes, resource for its resource’s.
What a rule keeps
keep |
Meaning |
|---|---|
"all" |
Keep the trace |
"none" |
Drop the trace |
{ "percent": p } |
Keep p% of the traces it matches, from 0.01 to 100 |
{ "perSecond": n } |
Keep up to n traces a second that match it in this dataset, from 1 to 10,000 |
percentis decided by trace ID, as in OpenTelemetry’s consistent probability sampling: the rightmost 56 bits of the trace ID are compared with a threshold forp. The same trace gets the same answer every time, in every dataset, and a trace kept at 5% is also kept at any higher percentage. Trace IDs must be random, as OpenTelemetry SDKs make them.perSecondfalls through when it’s used up. Pastntraces a second (with a burst ofn), the rule doesn’t match and the next rule is tried, then the default. So a rule such as “keep errors, up to 100 a second” followed by apercentrule still keeps a share of errors beyond 100 a second.defaultcan’t beperSecond.
Decision wait and incomplete traces
A trace is decided decisionWait after its first span arrives: arrival time, not the span’s
timestamps. Set it to cover your longest normal trace plus your exporters’ batching delay (the
OpenTelemetry SDK’s batch span processor exports every 5 seconds by default, and a Collector’s
batch processor adds its own timeout).
- Spans that arrive after their trace is decided follow that decision for about 10 minutes: they’re kept or dropped at once. After that, a late span is decided on its own spans, so a late span of a dropped error trace can be kept by itself, or one of a kept trace dropped.
- Very large traces are decided early, when they reach 10,000 spans or 32 MiB. Their later spans follow the decision.
- Under heavy load, when too many spans are waiting, the oldest traces are decided early,
under the same rules, on the spans that have arrived. The stats count them under
(memory). - Rules see only the spans that arrived in time. A
minDurationrule measures those spans, and astatusrule misses an error span that arrives after the decision.
A kept trace is searchable about decisionWait plus a few seconds after its first span arrives.
Changing the policy applies to traces decided from a few seconds after you save it. Turning sampling on applies to spans that arrive afterward, so a trace in flight at that moment can have some spans stored in full. Turning it off keeps every trace that arrives afterward; traces already waiting are decided under the last policy.
What sampling changes
| Sampled dataset | |
|---|---|
| Stored traces | Kept traces only. Dropped spans are never stored and can’t be recovered |
| Traces page, span search and trace reads | Kept spans only. Counts, error rates and latencies there are of stored traces, and aren’t re-weighted |
| Dashboards over raw traces | Kept spans only |
| Span metrics and the service map | Every span, kept or dropped, about a decision wait later than without sampling (30 seconds by default, up to about 2 minutes) |
| Service catalog request rates, error rates and latency | Every span (they’re span metrics) |
| Stored spans | Exactly as sent. Kept spans get no added attribute |
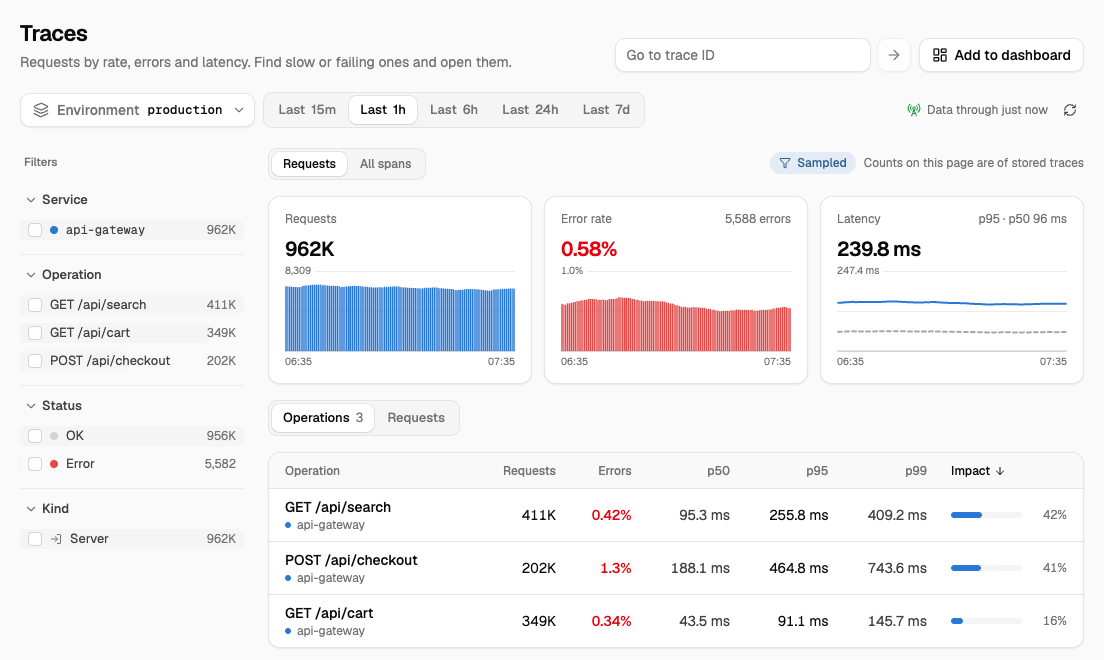
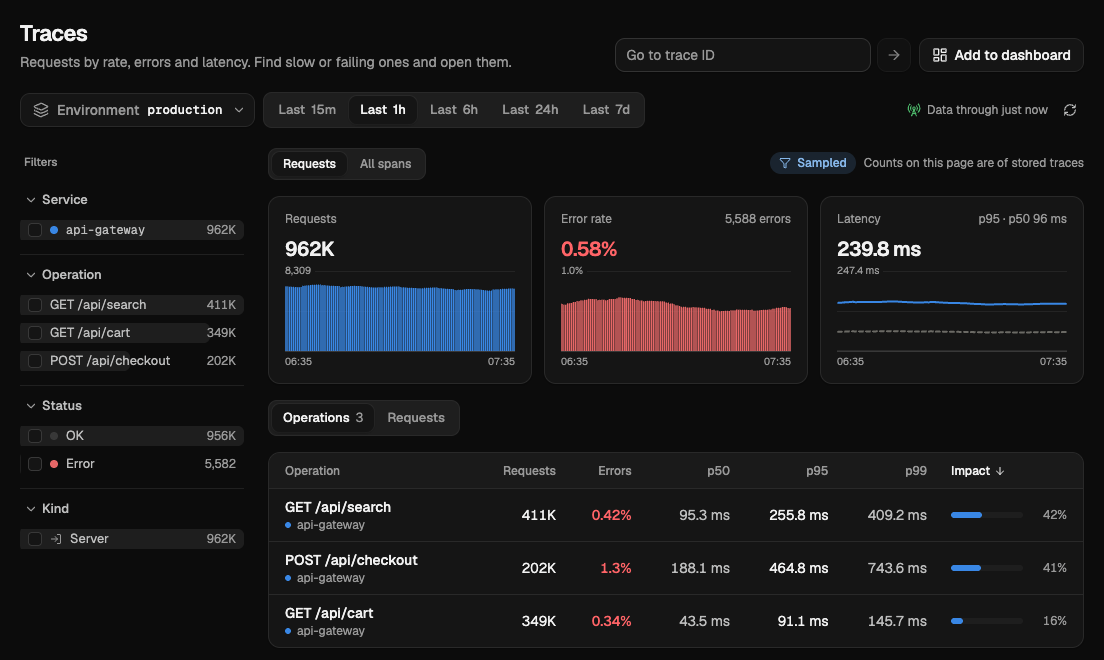
So a service’s requests and errors on its service page count every request, while its traces list shows the kept ones. The console marks this with a Sampled badge.
Rarely, after an interruption on Observability’s side, a kept trace’s spans can be stored twice,
as when an exporter retries; both copies are returned, with the same spanId. If Observability
falls behind deciding, sends to a sampled dataset can be refused with 503 and a retry delay, and
exporters retry them.
Billing and limits
- Only kept spans are metered. Dropped spans aren’t counted in the traces’ ingested bytes or in hot or cold stored bytes.
- Ingest rate limits count every span received, including the spans sampling then drops. The organization’s and the dataset’s rates apply before sampling.
- Span metrics stay free, and count every span.
Stats
For each dataset, Observability counts the traces and spans it received and kept over the last hour or the last 24 hours, and for each rule the traces it matched (decided) and kept.
{
  "window": "1h",
  "received": { "traces": 1203311, "spans": 18051976 },
  "kept":     { "traces": 113064,  "spans": 3618065 },
  "rules": [
    { "name": "errors",   "matched": { "traces": 8062 },   "kept": { "traces": 8062 } },
    { "name": "slow",     "matched": { "traces": 14560 },  "kept": { "traces": 14560 } },
    { "name": "health",   "matched": { "traces": 109742 }, "kept": { "traces": 0 } },
    { "name": "vip",      "matched": { "traces": 17942 },  "kept": { "traces": 17942 } },
    { "name": "checkout", "matched": { "traces": 108406 }, "kept": { "traces": 25270 } },
    { "name": "default",  "matched": { "traces": 944599 }, "kept": { "traces": 47230 } }
  ],
  "complete": true
}ruleslists the policy’s rules in order, thendefault, then(memory)when traces were decided early under load, then rules that have since been renamed or removed but still have counts in the window.matchedcounts the traces a rule decided. AperSecondrule’s traces that fell through are counted under the rule that decided them.completeisfalsewhen some of the window’s counts weren’t recorded, so the counts are lower than what was sampled.- Counts follow the traffic by about one decision wait.
In the console
Open Observability > Datasets, a dataset, then the Sampling tab.
- Set up sampling starts a policy. Turn Tail sampling on or off, set the Decision wait in seconds, add rules, reorder them with the arrows, edit or delete them, and choose the Default: Keep a percentage, Keep all or Drop. Save changes saves the whole policy; turning sampling off asks you to confirm.
- If someone else saved the policy since you opened it, saving says so and loads theirs, and your changes aren’t applied.
- Below the policy, a 1 hour / 24 hours switch shows the traces and spans received and kept, and each rule’s matched and kept traces with its kept share.
- Without
obs.datasets.update, the tab shows the policy and stats read-only.
A Sampled badge marks traces that come from a sampled dataset: on the dataset’s page, on the Traces page (“Counts on this page are of stored traces”), and on a service’s page and the service map next to the time range. A service’s View error traces and a map node’s View traces carry the badge too, with “Charts count every request; traces shows the sampled ones”. With All environments, the badge shows when any environment of the project samples. It opens the dataset’s Sampling tab, or the Datasets list when several environments sample.
From the CLI and the API
ezgh obs datasets sampling get production --project web
ezgh obs datasets sampling get production -o json --project web > sampling.json
ezgh obs datasets sampling set production -f sampling.json --project web
ezgh obs datasets sampling stats production --window 24h --project webgetshows whether sampling is on, the decision wait, the default, and the rules in order. With-o jsonit prints the policy with its version; edit the file and pass it toset.setreplaces the whole policy from a file (-f -reads standard input). The file can be a policy or the output ofget -o json. If someone changed the policy sincesetread it, nothing changes andsetsays so;--forceoverwrites it anyway.statsshows traces and spans received and kept, and each rule’s matched and kept traces, for--window 1h(the default) or24h.
The dataset is given by environment, ID, dst_ slug or name. See
ezgh obs datasets sampling.
A dataset’s policy is a sub-resource of the dataset, in the project’s Observability API:
| Operation | Request |
|---|---|
| GetDatasetSampling | GET /v1/organizations/<organization ID>/projects/<project ID>/obs/datasets/<dataset ID>/sampling |
| UpdateDatasetSampling | PUT …/obs/datasets/<dataset ID>/sampling |
| GetDatasetSamplingStats | GET …/obs/datasets/<dataset ID>/sampling/stats?window=1h |
GETreturns{ "policy": {…}, "version": 3, "updatedAt": "…" }with anETag. A dataset that never had a policy returnsenabledfalse, no rules,version0, and the dataset’s creation time asupdatedAt.PUTtakes a policy and replaces the whole policy;versiongoes up by one.If-Matchis optional: send the ETag fromGETso a change saved in the meantime answers412 precondition_failedinstead of being overwritten. It takes anIdempotency-Key.- A policy outside the bounds is
400 invalid_request, with every problem inissuesas{ "path", "message" }, wherepathis dotted with numeric indices, such asrules.2.keep.percent. PUTon a dataset being deleted is409 dataset_deleting.windowis1h(the default) or24h. Stats that can’t be read at the moment are503.
Limits
| Limit | Value |
|---|---|
| Rules | 20 per policy |
| Attribute filters | 10 per rule |
service and spanName values |
50 per list, each up to 255 bytes |
Attribute keys and equals values |
255 bytes |
decisionWait |
5 to 120 seconds, 30 by default |
minDuration |
More than 0, at most 1 hour |
percent |
0.01 to 100 |
perSecond |
1 to 10,000 |
| Policy | 64 KiB |
| Stats windows | The last hour, or the last 24 hours |
Access and Trails
| Action | Allows |
|---|---|
obs.datasets.get |
Viewing a dataset’s policy and stats |
obs.datasets.update |
Changing a dataset’s policy |
ObsFullAccess includes both; ObsReadOnlyAccess and ReadOnlyAccess include
obs.datasets.get.
Changing a policy is recorded in Trails as UpdateDatasetSampling, with eventSource
obs.ezghcloud.com. The event records whether sampling is on, the rule names and the new version,
not the rules’ conditions, because their values can be your data. Viewing a policy and its stats
isn’t recorded.