
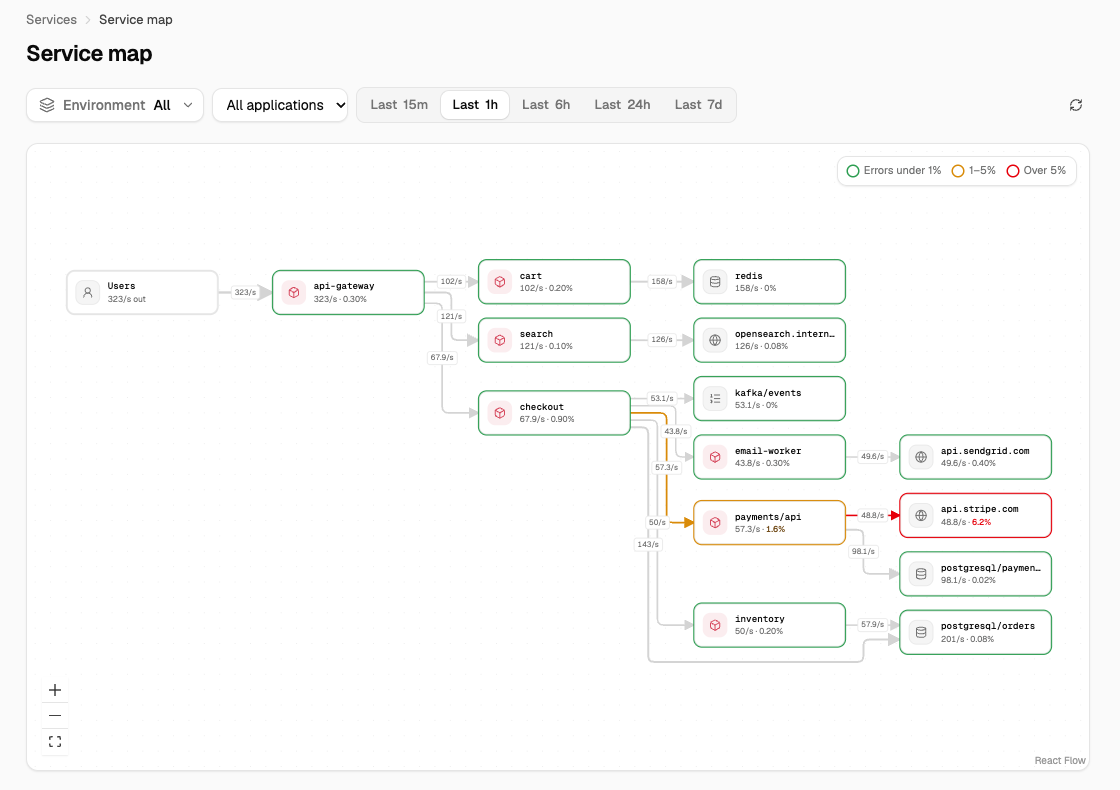
The service map draws a project’s services and what they call: other services, databases, queues, external hosts, and the users whose requests enter from outside. Each edge has its request rate and error rate, and each node its p95 latency. Observability builds it from the traces you already send, with no setup, for every dataset that receives traces.
Open the map
Open Observability > Services > Service map.
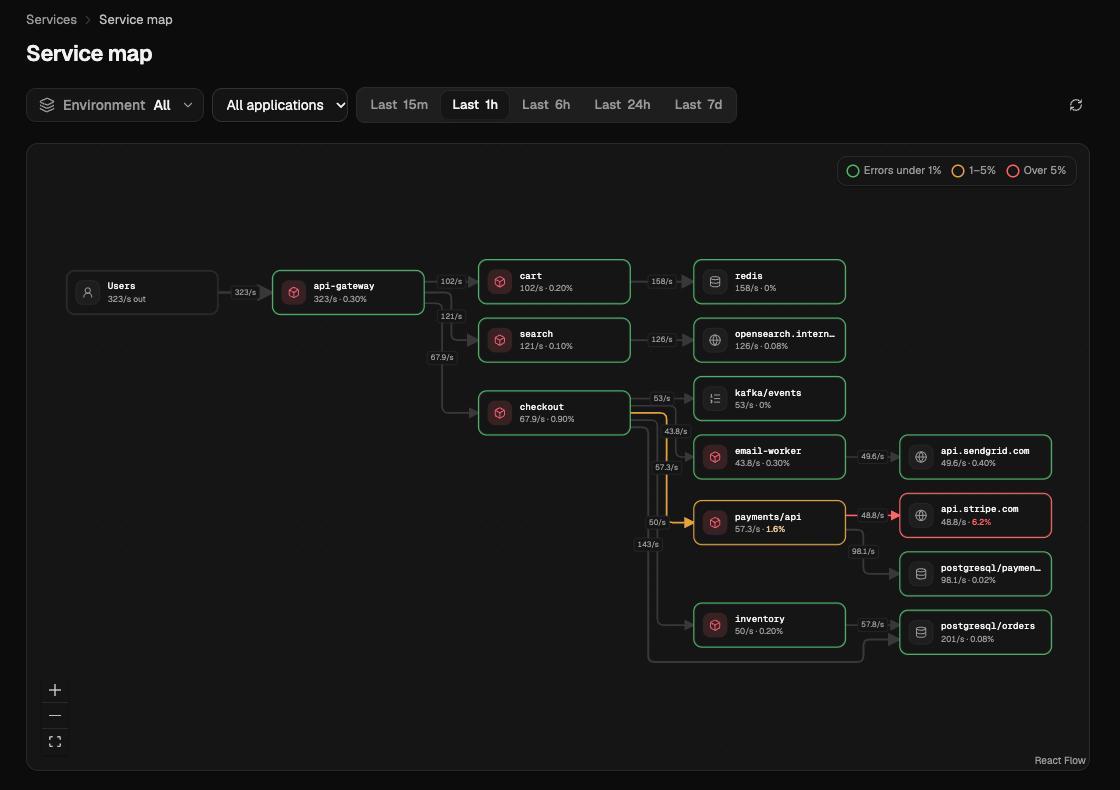
- Pick an environment (or All environments), an application, and a time range. Services are laid out left to right, callers before callees.
- Edges are labelled with requests per second. A node’s ring and an edge’s color show its error rate: under 1%, 1 to 5% (amber), or over 5% (red).
- Select a node to see its requests, errors and p95 latency, what calls it and what it calls, and Open service for its page in the service catalog.
- A map with more than 300 nodes asks you to pick an application first.
A service’s Dependencies tab shows the same edges for one service: Called by and
Calls. ezgh obs services deps <service> prints them.
The map reads the service-graph series with PromQL, so it needs obs.metrics.query. The series
are listed in Span metrics, and Grafana can
chart them too.
How spans are paired
A request between two instrumented services leaves two spans in one trace: a client span
(kind client or producer) in the caller, and a server span (kind server or consumer)
in the callee whose parent is that client span. Observability matches the two and counts one
request on the edge from the caller’s service to the callee’s.
- Whichever span arrives first waits up to 10 seconds for the other. Spans are matched as they arrive, so the 10 seconds count from when each span reaches Observability, not from its timestamps.
- The request failed when either span has status
error. - The edge records both spans’ durations: the server span’s (latency as the callee measured it) and the client span’s (as the caller measured it, network included).
- Services are named by their key,
service.namespace/service.name.
Virtual nodes
A callee that sends no spans of its own, such as a database, a queue, a managed service or an external API, still appears on the map. When a client span’s 10 seconds pass with no server span, the callee is named from the client span’s attributes, the first that’s set:
| Attribute | Node | Example | Shown as |
|---|---|---|---|
peer.service |
Its value | payments-provider |
External |
db.system.name or db.system, with db.namespace |
The system, plus / and the namespace when set |
postgresql/orders |
Database |
messaging.system, with messaging.destination.name |
The system, plus / and the destination when it isn’t templated (messaging.destination.template unset) |
kafka/events |
Queue |
server.address |
Its value | api.stripe.com |
External |
A client span with none of these isn’t drawn; it’s counted as unpaired.
Requests that enter from outside come from Users (the node user): a server span with no
parent span, such as the first span of a request from a browser or a load balancer that doesn’t
trace, is counted on an edge from user to its service when its 10 seconds pass.
A node’s p95 latency is taken from the side of its edges that has a span to time. For a
database, queue or external host, that’s the client span (the caller’s measure, from
traces_service_graph_request_client_seconds), because there’s no server span. For a service,
including requests from users, it’s the server span (…_server_seconds). When the chosen side
has no data, the other side is used. A node with several callers shows their p95s averaged by
request rate, an approximation; a service’s Dependencies tab has each edge’s own p95.
What isn’t paired
The map is an approximation by design, as in Grafana Tempo, whose service graph it matches:
- Late spans. When the other span arrives more than 10 seconds after the first, the edge is missed: the client span becomes a virtual node (or unpaired), and the server span is counted as unpaired. Long batching delays in an SDK or Collector cause this.
- Across environments or projects. Spans are paired only within one dataset. A call from a
stagingservice to aproductionone, or to another project, isn’t an edge between the two services. - Uninstrumented callers. A server span whose parent is a span that never arrives, such as one from a proxy that propagates trace context without sending spans, is unpaired.
- Internal spans (kind
internal) don’t make edges; they count in span metrics only. - Spans stored straight to cold storage generate nothing; see Span metrics.
- Busy periods. If too many spans are waiting at once, new ones aren’t paired and are counted
in
traces_service_graph_dropped_spans_total. Their span metrics are still counted. - After an interruption on Observability’s side, an edge can count up to 15 seconds of requests twice.
traces_service_graph_unpaired_spans_total counts the spans that weren’t paired, by
client or server service. A large share of unpaired server spans usually means a caller’s
client spans are missing or arrive late.
Sampling doesn’t change these counts
In a dataset with trace sampling, the map counts every request, whether its trace is kept or dropped: the service-graph series are generated from every span received. They follow the spans by about a decision wait longer than usual (30 seconds by default, up to about 2 minutes). A map node’s View traces opens the kept traces only, so it finds fewer requests than the map shows; the console marks this with a Sampled badge and “Charts count every request; traces shows the sampled ones”.
Access and Trails
Reading the map needs obs.metrics.query on the environment’s dataset, which ObsFullAccess,
ObsReadOnlyAccess and ReadOnlyAccess include; opening a service needs obs.services.list (to find it by key) and obs.services.get.
Reading the map isn’t recorded in Trails.