
An alert rule is a condition over one of a project’s signals, evaluated every minute. Each label set the condition matches is an alert instance, and the rule notifies its contact points as instances fire and resolve.
The document
A rule is a JSON document. It’s what the console’s JSON tab shows, and what
ezgh obs alert-rules apply -f takes.
{
  "name": "API p95 latency",
  "description": "p95 latency of the public API, by service",
  "enabled": true,
  "condition": {
    "promql": {
      "expr": "histogram_quantile(0.95, sum by (service, le) (rate(traces_spanmetrics_latency_bucket{environment=\"production\", span_kind=~\"SPAN_KIND_SERVER|SPAN_KIND_CONSUMER\"}[5m]))) > 0.5"
    }
  },
  "for": "5m",
  "keepFiringFor": "0m",
  "noData": "noData",
  "onError": "error",
  "labels": { "severity": "critical", "team": "platform" },
  "annotations": {
    "summary": "{{ $labels.service }} p95 is {{ $value | humanizeDuration }}",
    "description": "Above 500 ms for 5 minutes."
  },
  "contactPoints": ["01990c3e-5f2a-7b1d-9c4e-2a6f8d0b1e37"],
  "repeatInterval": "4h",
  "notifyOnResolve": true
}| Field | Value |
|---|---|
name |
1 to 100 characters. Required. It’s also every instance’s alertname label |
description |
Up to 1,000 characters |
enabled |
false stops evaluating the rule; its instances are removed. Default true |
condition |
Exactly one of promql, logs and traces. Required |
for |
How long the condition must hold before an instance fires: 0m to 24h, in whole minutes. Default 0m, which fires at once |
keepFiringFor |
How long a firing instance keeps firing after the condition stops holding: 0m to 24h, in whole minutes. Default 0m |
noData |
What a logs or traces condition that finds no data does: noData, alerting or ok. Default noData; see No data |
onError |
What a rule error does: error or ok. Default error |
labels |
Up to 32 static labels added to every instance |
annotations |
Up to 16 templates rendered for each instance, such as summary and description |
contactPoints |
0 to 10 contact point IDs of the same project. Default none |
repeatInterval |
How often a still-firing instance is notified again: 5m to 7d. Default 4h |
notifyOnResolve |
Notify when instances resolve. Default true |
Durations are written as Prometheus writes them: 30s, 5m, 1h30m, 7d. contactPoints
takes IDs, not names: find them in a contact point’s JSON, or with
ezgh obs contact-points get <name> -o json. A rule with no contact points is still evaluated
and keeps its state, notifies no one, and carries the warning noContactPoints.
Metrics (PromQL)
{ "promql": { "expr": "sum by (service) (rate(traces_spanmetrics_calls_total{environment=\"production\", status_code=\"STATUS_CODE_ERROR\"}[5m])) > 1" } }The expression follows Prometheus’s alerting rule semantics:
- It includes the comparison. Every series it returns is an active instance; an empty result
means nothing is active.
rate(x[5m]) > 1alerts;rate(x[5m])alone fires for every series. - Its value is the instance’s
$value. It must be an instant vector: a scalar or a range vector is refused. - An empty result is never “no data”. To alert on a series that stops arriving, use
absent()orabsent_over_time(), as in Prometheus:absent_over_time(up{job="api"}[10m]). - It reads all of the project’s environments. Select one with the
environmentlabel, as in the Metrics page’s queries. - Names and labels are those the Prometheus API uses, including span metrics and the Kubernetes agent’s metrics.
Bounds, checked when the rule is saved:
- Every range, subquery range and
offset, added up along any path through the expression, is at most 1 hour.rate(x[5m] offset 50m)is fine;rate(x[1h] offset 5m)isn’t. For longer windows, alert on span metrics or another recorded series over a shorter range. - The
@modifier isn’t allowed: a rule always evaluates at its evaluation time. - At most 8 KiB of expression.
- At most 1,000 instances. An expression that returns more when the rule is saved is refused;
one that returns more later is a rule error. Aggregate with
sum by (…)to fewer series. - Two series that become the same label set once the rule’s labels are applied (a static label replacing the label that told them apart) are a rule error, as in Prometheus.
Logs and traces
A logs or traces condition counts or measures one environment’s records over the last window
minutes, optionally grouped, and compares each group’s value with a threshold. Each group whose
value satisfies the threshold is an active instance.
{
  "logs": {
    "dataset": "0199a3b4-2c1d-7e5f-8a9b-1c2d3e4f5a6b",
    "filter": { "severityTexts": ["ERROR"] },
    "aggregate": { "fn": "count" },
    "groupBy": [{ "field": "serviceName" }],
    "window": "5m",
    "threshold": { "op": ">", "value": 100 }
  }
}| Field | Value |
|---|---|
dataset |
The environment’s dataset ID. Required |
filter |
Which records count, as a search filters them. Optional: none counts every record |
aggregate |
One measure, { "fn" } or { "fn", "field" }. Required |
groupBy |
Up to 2 fields; each group is its own instance. Optional |
window |
1m to 15m, in whole minutes. Required |
threshold |
{ "op", "value" }: op is >, >=, <, <=, == or !=. Required |
- Logs filters are a log search’s:
severityTexts(such as["ERROR", "FATAL"]),minSeverityNumber,serviceNames,applications,attributes(each{ "scope", "key", "op", "value" },opequalsorexists) andbody({ "contains" }or{ "matches" }, an RE2 pattern). - Traces filters are a span search’s:
services,applications,spanNames,kinds(server,client,internal,producer,consumer,unspecified),statuses(ok,error,unset),minDurationNanos,maxDurationNanos,rootOnlyandattributes. - Measures are the dashboard panels’:
count,rate(per second),countDistinct,sum,avg,min,max,p50,p90,p95andp99, and for traceserrorsanderrorRate(a fraction from 0 to 1). A measure of a field reads a numeric attribute ({ "field": { "scope": "record", "key": "bytes" } }), or a span’sduration, in nanoseconds: a p95 latency over 500 ms is{ "fn": "p95", "field": "duration" }with a threshold of500000000. - Group by a field: for logs
severityText,serviceName,scopeNameorapplication; for spansserviceName,application,name,statusCodeorkind. Or by an attribute,{ "field": { "scope": "record", "key": "http.route" } }. Each field becomes a label of the instance: the field’s name, orrecord.<key>andresource.<key>for attributes, so a silence can matchserviceName=checkout. - At most 50 groups. A condition whose result has more is a rule error (“more than 50 groups; narrow its filter or group by fewer fields”), never silently cut. Group by fewer fields, or filter.
Every evaluation reads its whole window again, which is why windows end at 15 minutes. For longer windows, alert in PromQL on span metrics, which count every span cheaply.
Sampled traces
On a dataset with trace sampling on, a traces condition sees only the
kept spans. Counts, rates, error rates and latency percentiles are biased toward what the
policy keeps: a policy that keeps every error and 5% of the rest makes the error rate look about
20 times higher than it is. The rule is saved with the warning sampledData, and the console’s
editor offers Use span metrics instead.
Span metrics count every span, kept or dropped. Write the condition in PromQL over them instead:
# Error rate of checkout's requests, every span counted
sum(rate(traces_spanmetrics_calls_total{environment="production", service="checkout", span_kind=~"SPAN_KIND_SERVER|SPAN_KIND_CONSUMER", status_code="STATUS_CODE_ERROR"}[5m]))
  / sum(rate(traces_spanmetrics_calls_total{environment="production", service="checkout", span_kind=~"SPAN_KIND_SERVER|SPAN_KIND_CONSUMER"}[5m])) > 0.05
A traces condition on a sampled dataset is also evaluated a decision wait (30 seconds by default) later than other rules, so it doesn’t read traces that haven’t been decided yet.
for and keepFiringFor
- An instance whose condition starts holding is pending. It fires once the condition has
held for
forat every evaluation since, or at once whenforis0m. If the condition stops holding while it’s pending, it goes away without notifying, and starts over next time. - A firing instance whose condition stops holding stays firing for
keepFiringFor, then resolves. If the condition holds again in the meantime, nothing changes. Use it for conditions that flap. forandkeepFiringForare whole minutes, since rules are evaluated every minute.
No data
noData applies to logs and traces conditions that find no groups at all:
- A
count,rate,errors,countDistinctorsumwithoutgroupByis0when nothing matches, so it never has no data. Use it, with<, to alert when something stops happening. - A
min,max,avg, percentile orerrorRatewithoutgroupByhas no value when nothing matches: that’s no data, never0. “Minimum latency under 50 ms” doesn’t fire on an empty window. - A grouped condition has no groups when nothing matches, whatever its function: that’s no data.
noData |
When there’s no data |
|---|---|
noData (the default) |
One instance with the rule’s labels, in the No data state. It honors for and notifies like a firing one (noData notifications) |
alerting |
One instance with the rule’s labels, as if the condition held: pending, then firing |
ok |
Nothing: the rule is OK |
A grouped count of errors (“more than 100 ERROR logs per service”) finds no groups when there
are no errors at all, so set "noData": "ok" on it unless silence itself is a problem.
noData doesn’t apply to PromQL conditions: an empty result means nothing is active.
Errors
A rule error is caused by the rule itself:
- the query is refused, for example a dataset that has been deleted;
- more than 1,000 instances (PromQL) or more than 50 groups (logs and traces);
- over the evaluation budget for data read or memory;
- three timeouts in a row while Observability is otherwise healthy.
onError decides what it does:
onError |
A rule error |
|---|---|
error (the default) |
Puts the rule in the Error state and sends an error notification when it enters it |
ok |
Records the error on the rule, without changing its state or notifying |
Either way, the rule’s instances keep the state they had until an evaluation succeeds: nothing resolves or repeats because of an error. The console shows the error on the rule and on the Alerts page (“1 rule’s query fails”).
Errors on EZGH’s side never notify you, whatever onError says: the evaluation is delayed and
the rule’s state held; see When EZGH has a problem.
Late data
Rules are evaluated about 30 seconds behind real time, so the data of the minute being evaluated has arrived. If some of it hasn’t (ingest is behind), the evaluation is delayed: instances can become pending or firing on what has arrived, but nothing resolves and nothing enters no data until the data has caught up. A late minute can’t resolve an alert or report no data on its own.
Labels and annotations
Labels are static: "severity": "critical". They’re added to every instance, replace a
series label of the same name, and are what silences match.
Names are Prometheus label names (a letter or _, then letters, digits or _), and values 1 to
1,024 bytes. alertname, and names starting with ezgh_ or __, are reserved.
Annotations are Go templates, as in Prometheus, rendered for each instance when it’s notified:
{{ $labels.service }} p95 is {{ $value | humanizeDuration }}
{{ $labels.serviceName }} logged {{ $value }} errors in 5 minutes
Error rate {{ $value | humanizePercentage }} on {{ $labels.service }}$labels(or.Labels) are the instance’s labels, and$value(or.Value) its value.$externalLabelsis empty.- Prometheus’s template functions are available, except
query:humanize,humanize1024,humanizeDuration,humanizePercentage,humanizeTimestamp,title,toUpper,toLower,reReplaceAll,match,printfand the others that need no query. A notification can’t run a query, so it never carries log lines or other data a rule reads. range,template,defineandblockaren’t allowed. Aprintfwidth or precision over 999 fails when it’s rendered.- Keys are label names; each template is at most 4 KiB, and its rendered text is cut at 16 KiB.
- A template that doesn’t parse is refused when the rule is saved. If one fails when it’s
rendered, all of that alert’s annotations are sent as their raw template text, and the rule gets
the warning
annotationTemplate.
Repeat and resolve
- While instances keep firing (or stay without data), the rule notifies them again every
repeatInterval(default 4 hours). Once one instance is due, the repeat lists every instance still firing or without data that isn’t silenced, and they’re all due again arepeatIntervallater. - With
notifyOnResolve(the default), instances that were notified as firing are notified when they resolve. - Each evaluation sends at most one notification of each kind per contact point: instances that fire in the same minute go together.
- Silenced instances are left out of notifications.
Preview and the cost check
Preview in the editor, ezgh obs alert-rules test and POST alert-rules/test evaluate an
unsaved rule once, at the current evaluation time or a time you choose, and save nothing. The
answer has:
- the instances it would have now, each as if it had just become active (pending, or firing when
foris0m); - the condition’s values over the previous 6 hours, a point a minute, for the chart with its
threshold (the warning
seriesUnavailablewhen they couldn’t be read); - the rows and bytes the evaluation read, and its warnings.
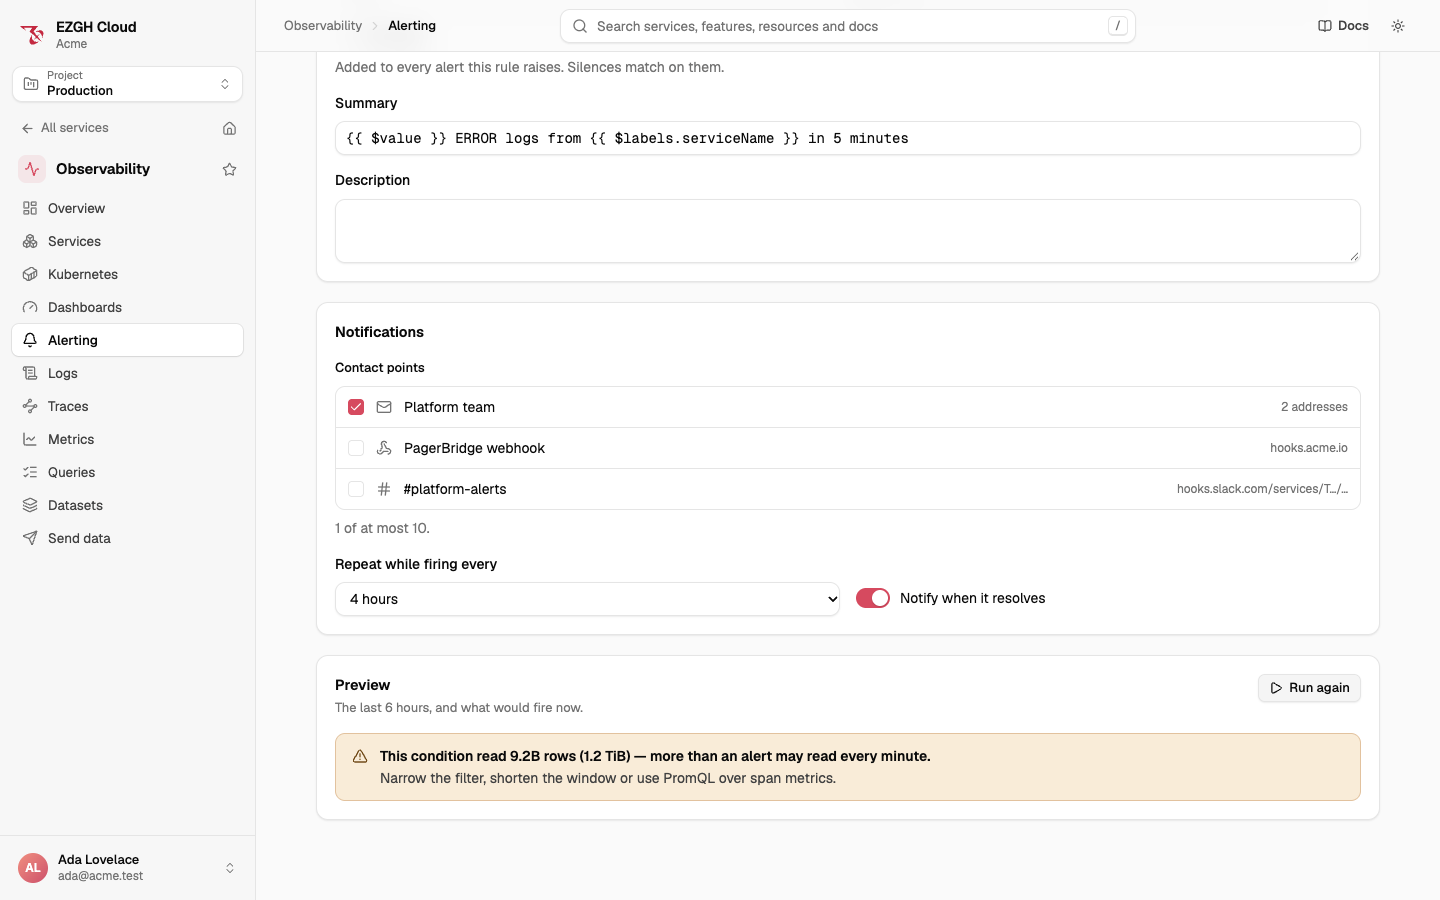
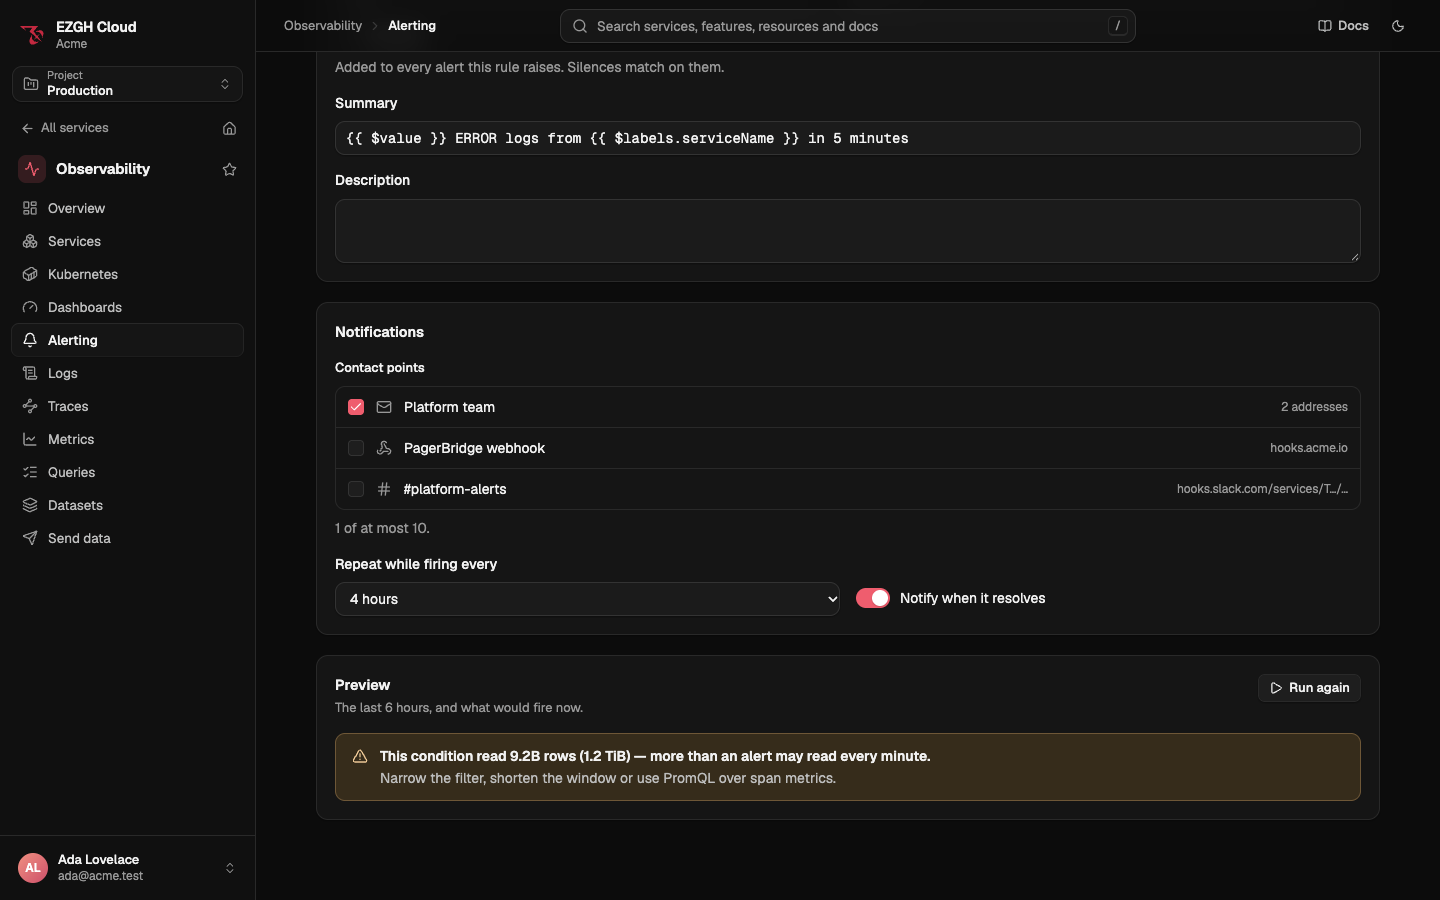
Creating a rule, or changing its condition, runs the same evaluation first. A condition that
reads more than an evaluation may every minute is refused with 422 rule_too_expensive, with
readRows, readBytes and the budget it went over in the error’s details. A condition the
query engine refuses, or one with more than 1,000 instances or 50 groups, is
400 invalid_request with an issue at condition. Narrow it: filter, group by fewer fields,
shorten the window, or use PromQL over span metrics. If the check can’t run because of an issue
on EZGH’s side, the rule is saved and checked at its first evaluation.
Recipes
These use span metrics, which every dataset with traces has, and the Kubernetes agent’s metrics. Replace the dataset and contact point IDs with your own.
p95 latency from span metrics
{
  "name": "Checkout p95 latency",
  "condition": {
    "promql": {
      "expr": "histogram_quantile(0.95, sum by (service, le) (rate(traces_spanmetrics_latency_bucket{environment=\"production\", service=\"shop/checkout\", span_kind=~\"SPAN_KIND_SERVER|SPAN_KIND_CONSUMER\"}[5m]))) > 0.5"
    }
  },
  "for": "5m",
  "labels": { "severity": "critical" },
  "annotations": { "summary": "{{ $labels.service }} p95 is {{ $value | humanizeDuration }}" },
  "contactPoints": ["01990c3e-5f2a-7b1d-9c4e-2a6f8d0b1e37"]
}
Latency buckets are in seconds. Drop service=… and keep sum by (service, le) to get one
instance per service.
Error rate from span metrics
{
  "name": "Service error rate",
  "condition": {
    "promql": {
      "expr": "sum by (service) (rate(traces_spanmetrics_calls_total{environment=\"production\", span_kind=~\"SPAN_KIND_SERVER|SPAN_KIND_CONSUMER\", status_code=\"STATUS_CODE_ERROR\"}[5m])) / sum by (service) (rate(traces_spanmetrics_calls_total{environment=\"production\", span_kind=~\"SPAN_KIND_SERVER|SPAN_KIND_CONSUMER\"}[5m])) > 0.05"
    }
  },
  "for": "5m",
  "labels": { "severity": "warning" },
  "annotations": { "summary": "{{ $labels.service }} errors at {{ $value | humanizePercentage }}" },
  "contactPoints": ["01990c3e-5f2a-7b1d-9c4e-2a6f8d0b1e37"]
}
ERROR logs per service
{
  "name": "ERROR logs per service",
  "condition": {
    "logs": {
      "dataset": "0199a3b4-2c1d-7e5f-8a9b-1c2d3e4f5a6b",
      "filter": { "severityTexts": ["ERROR"] },
      "aggregate": { "fn": "count" },
      "groupBy": [{ "field": "serviceName" }],
      "window": "5m",
      "threshold": { "op": ">", "value": 100 }
    }
  },
  "noData": "ok",
  "labels": { "severity": "warning" },
  "annotations": { "summary": "{{ $labels.serviceName }} logged {{ $value }} errors in 5 minutes" },
  "contactPoints": ["01990c3e-5f2a-7b1d-9c4e-2a6f8d0b1e37"]
}
"noData": "ok": with no ERROR logs at all there are no groups, which isn’t a problem here.
A log line that must appear every 10 minutes
{
  "name": "Backup heartbeat missing",
  "condition": {
    "logs": {
      "dataset": "0199a3b4-2c1d-7e5f-8a9b-1c2d3e4f5a6b",
      "filter": { "serviceNames": ["backup"], "body": { "contains": "backup finished" } },
      "aggregate": { "fn": "count" },
      "window": "10m",
      "threshold": { "op": "<", "value": 1 }
    }
  },
  "labels": { "severity": "critical" },
  "annotations": { "summary": "No \"backup finished\" log in the last 10 minutes" },
  "contactPoints": ["01990c3e-5f2a-7b1d-9c4e-2a6f8d0b1e37"]
}
An ungrouped count is 0 when nothing matches, so the rule fires instead of reporting no data.
A Kubernetes pod restarting
{
  "name": "Pod restarting",
  "condition": {
    "promql": {
      "expr": "sum by (k8s_cluster_name, k8s_namespace_name, k8s_pod_name) (increase(k8s_container_restarts[15m])) > 2"
    }
  },
  "labels": { "severity": "warning" },
  "annotations": { "summary": "{{ $labels.k8s_namespace_name }}/{{ $labels.k8s_pod_name }} restarted {{ $value | humanize }} times in 15 minutes" },
  "contactPoints": ["01990c3e-5f2a-7b1d-9c4e-2a6f8d0b1e37"]
}
k8s_container_restarts is the agent’s
restart count, a gauge that increase() reads.
In the console
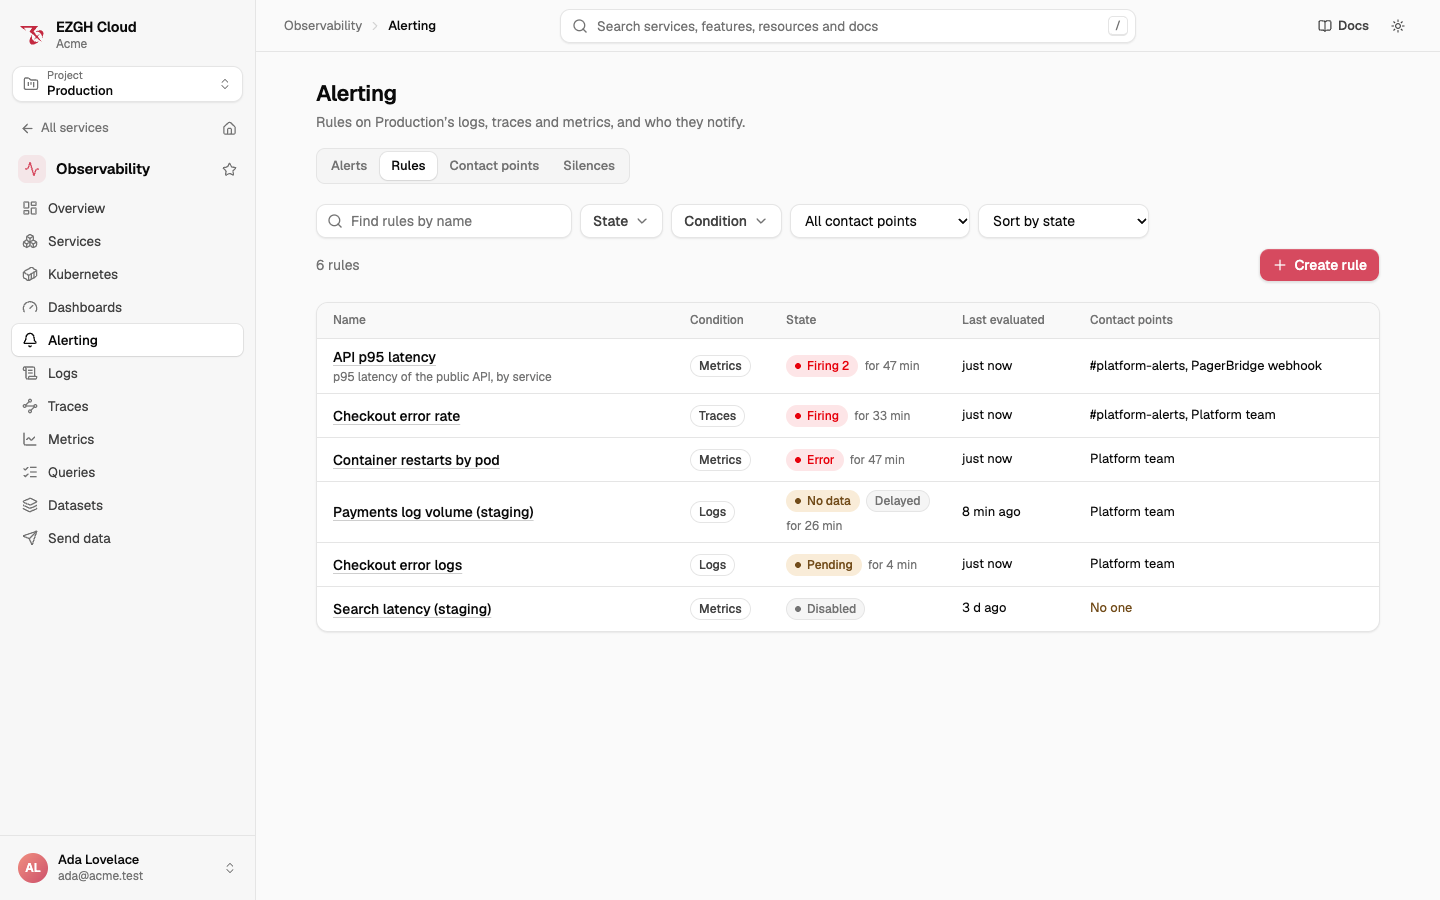
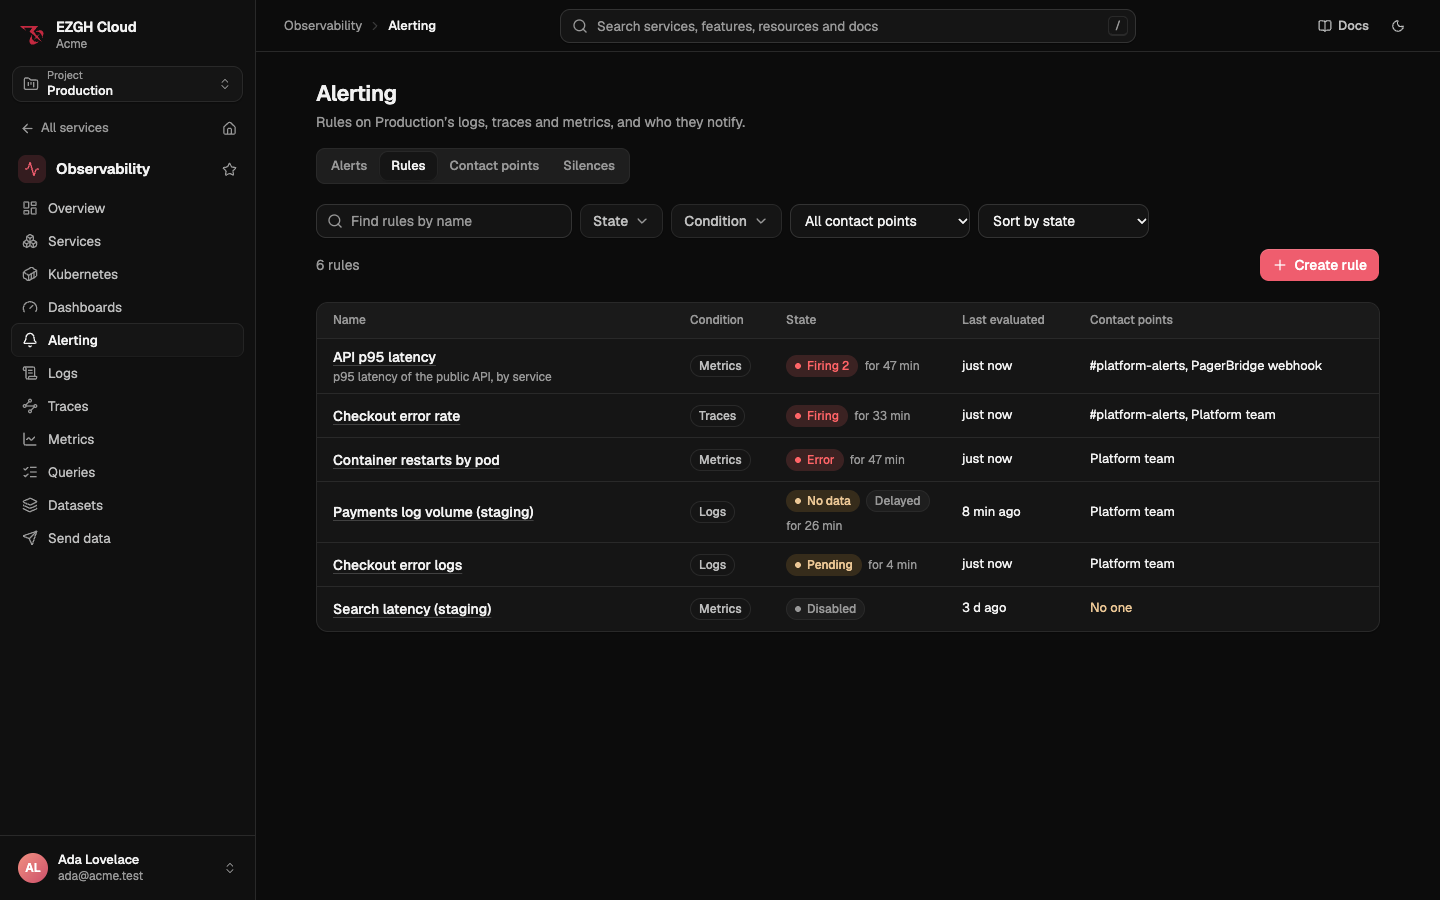
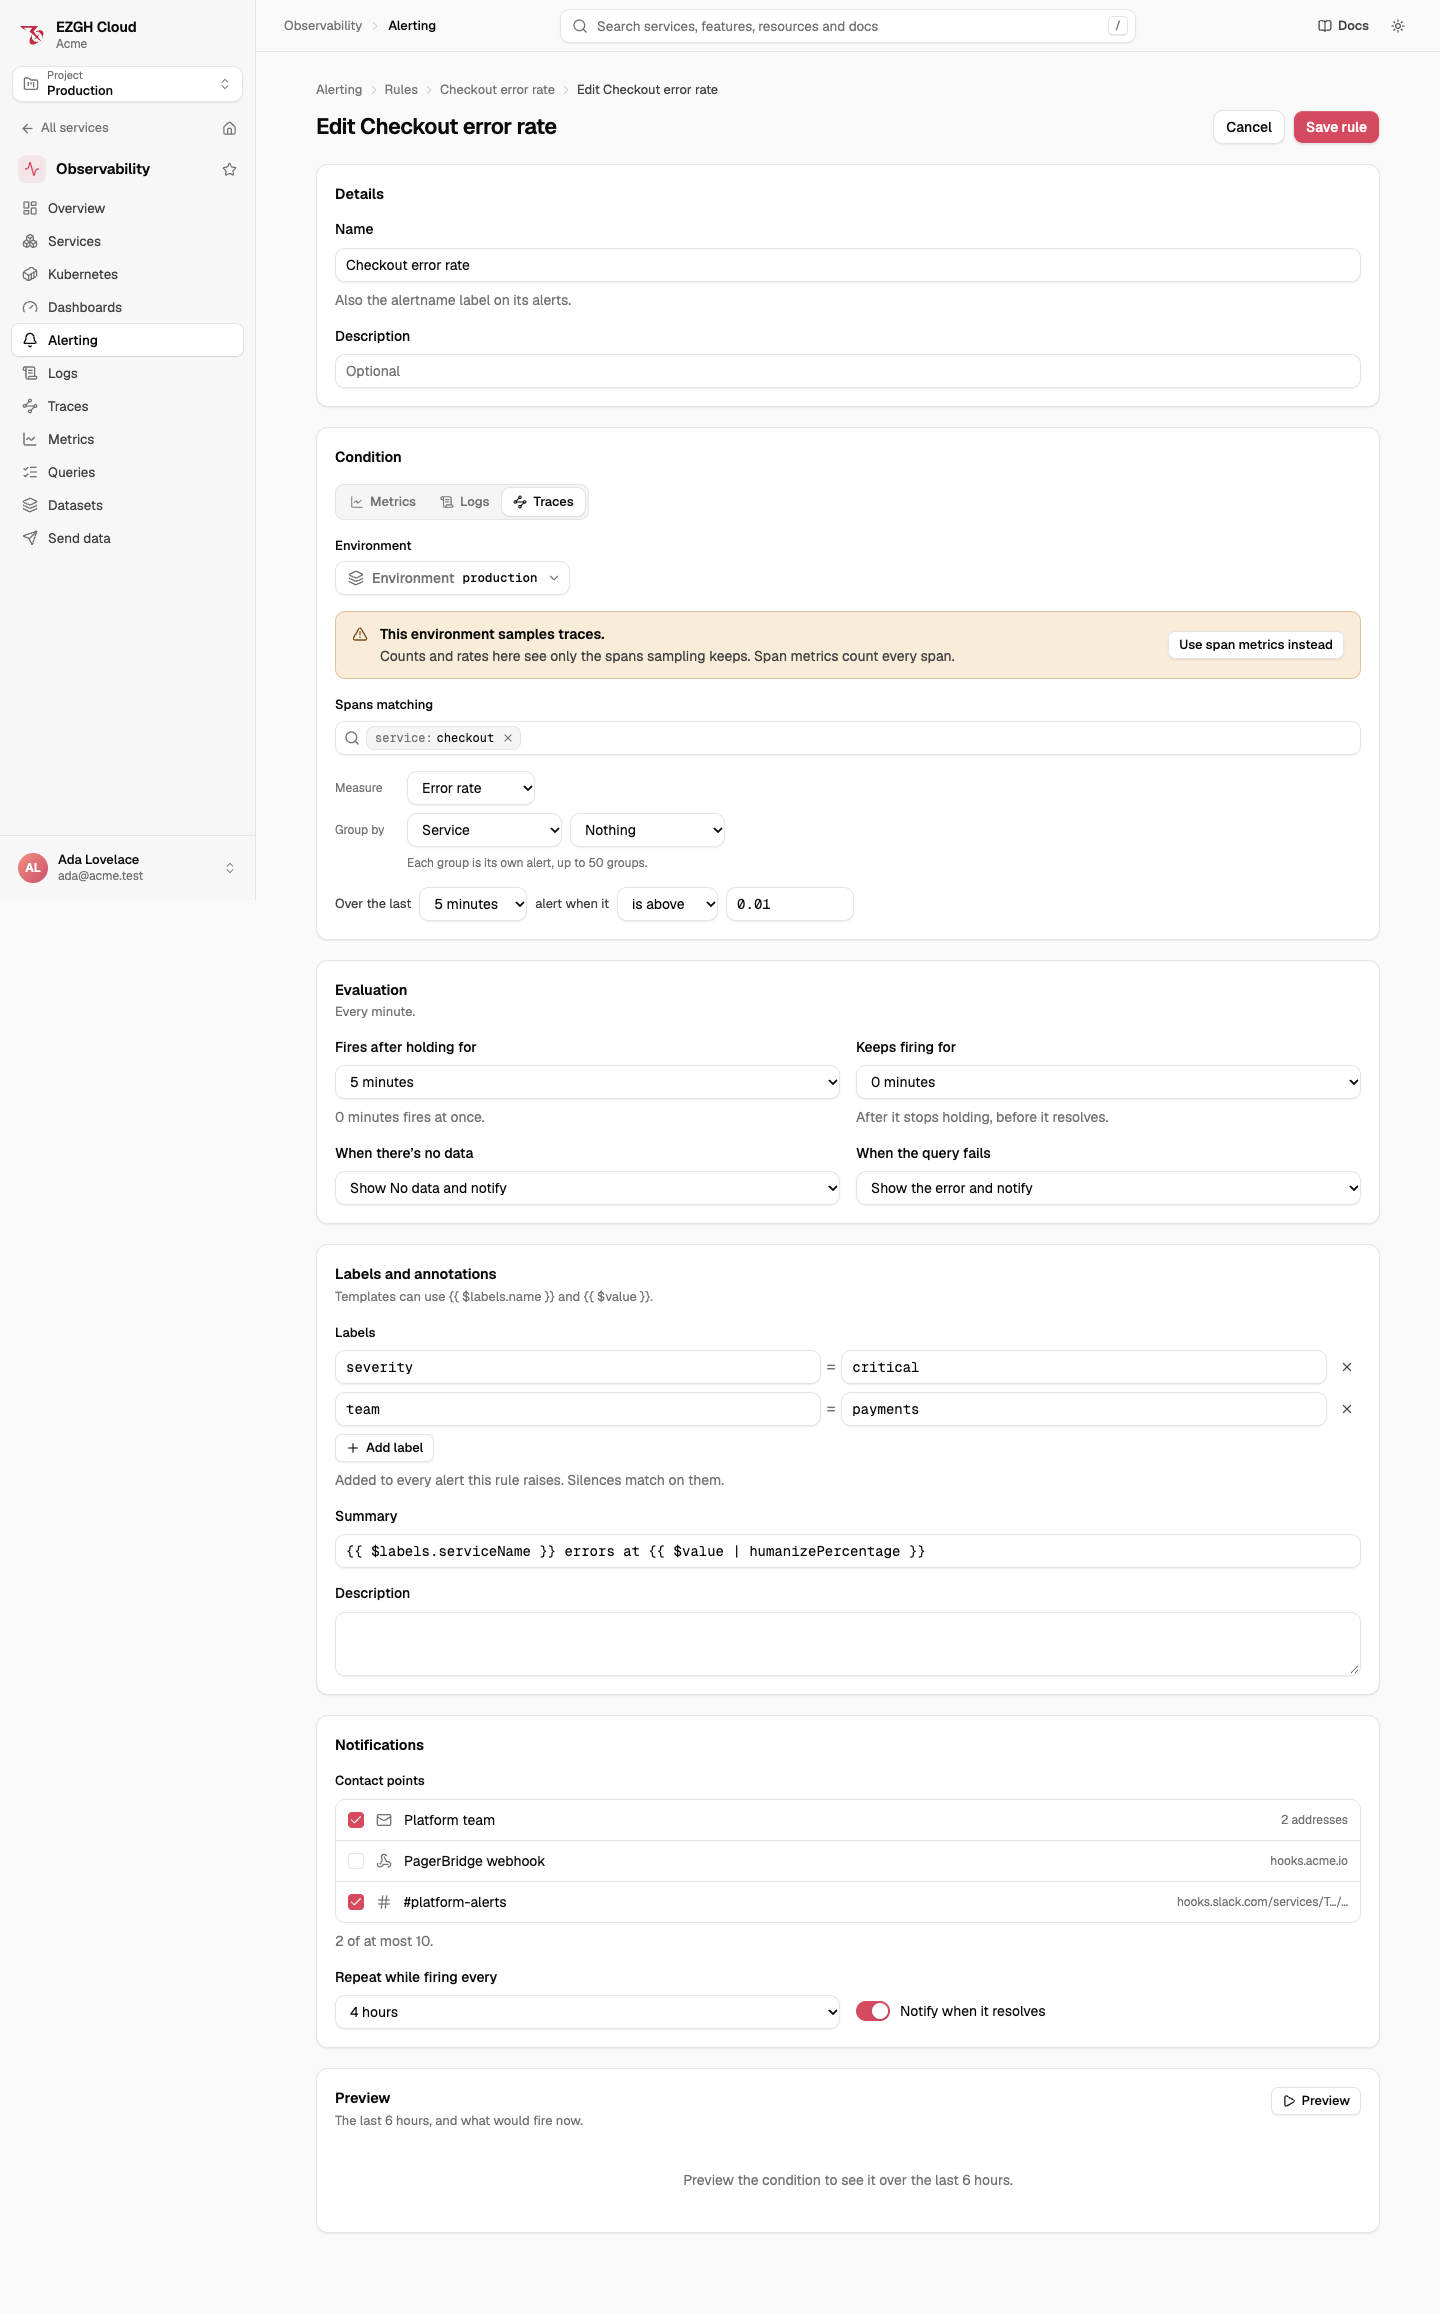
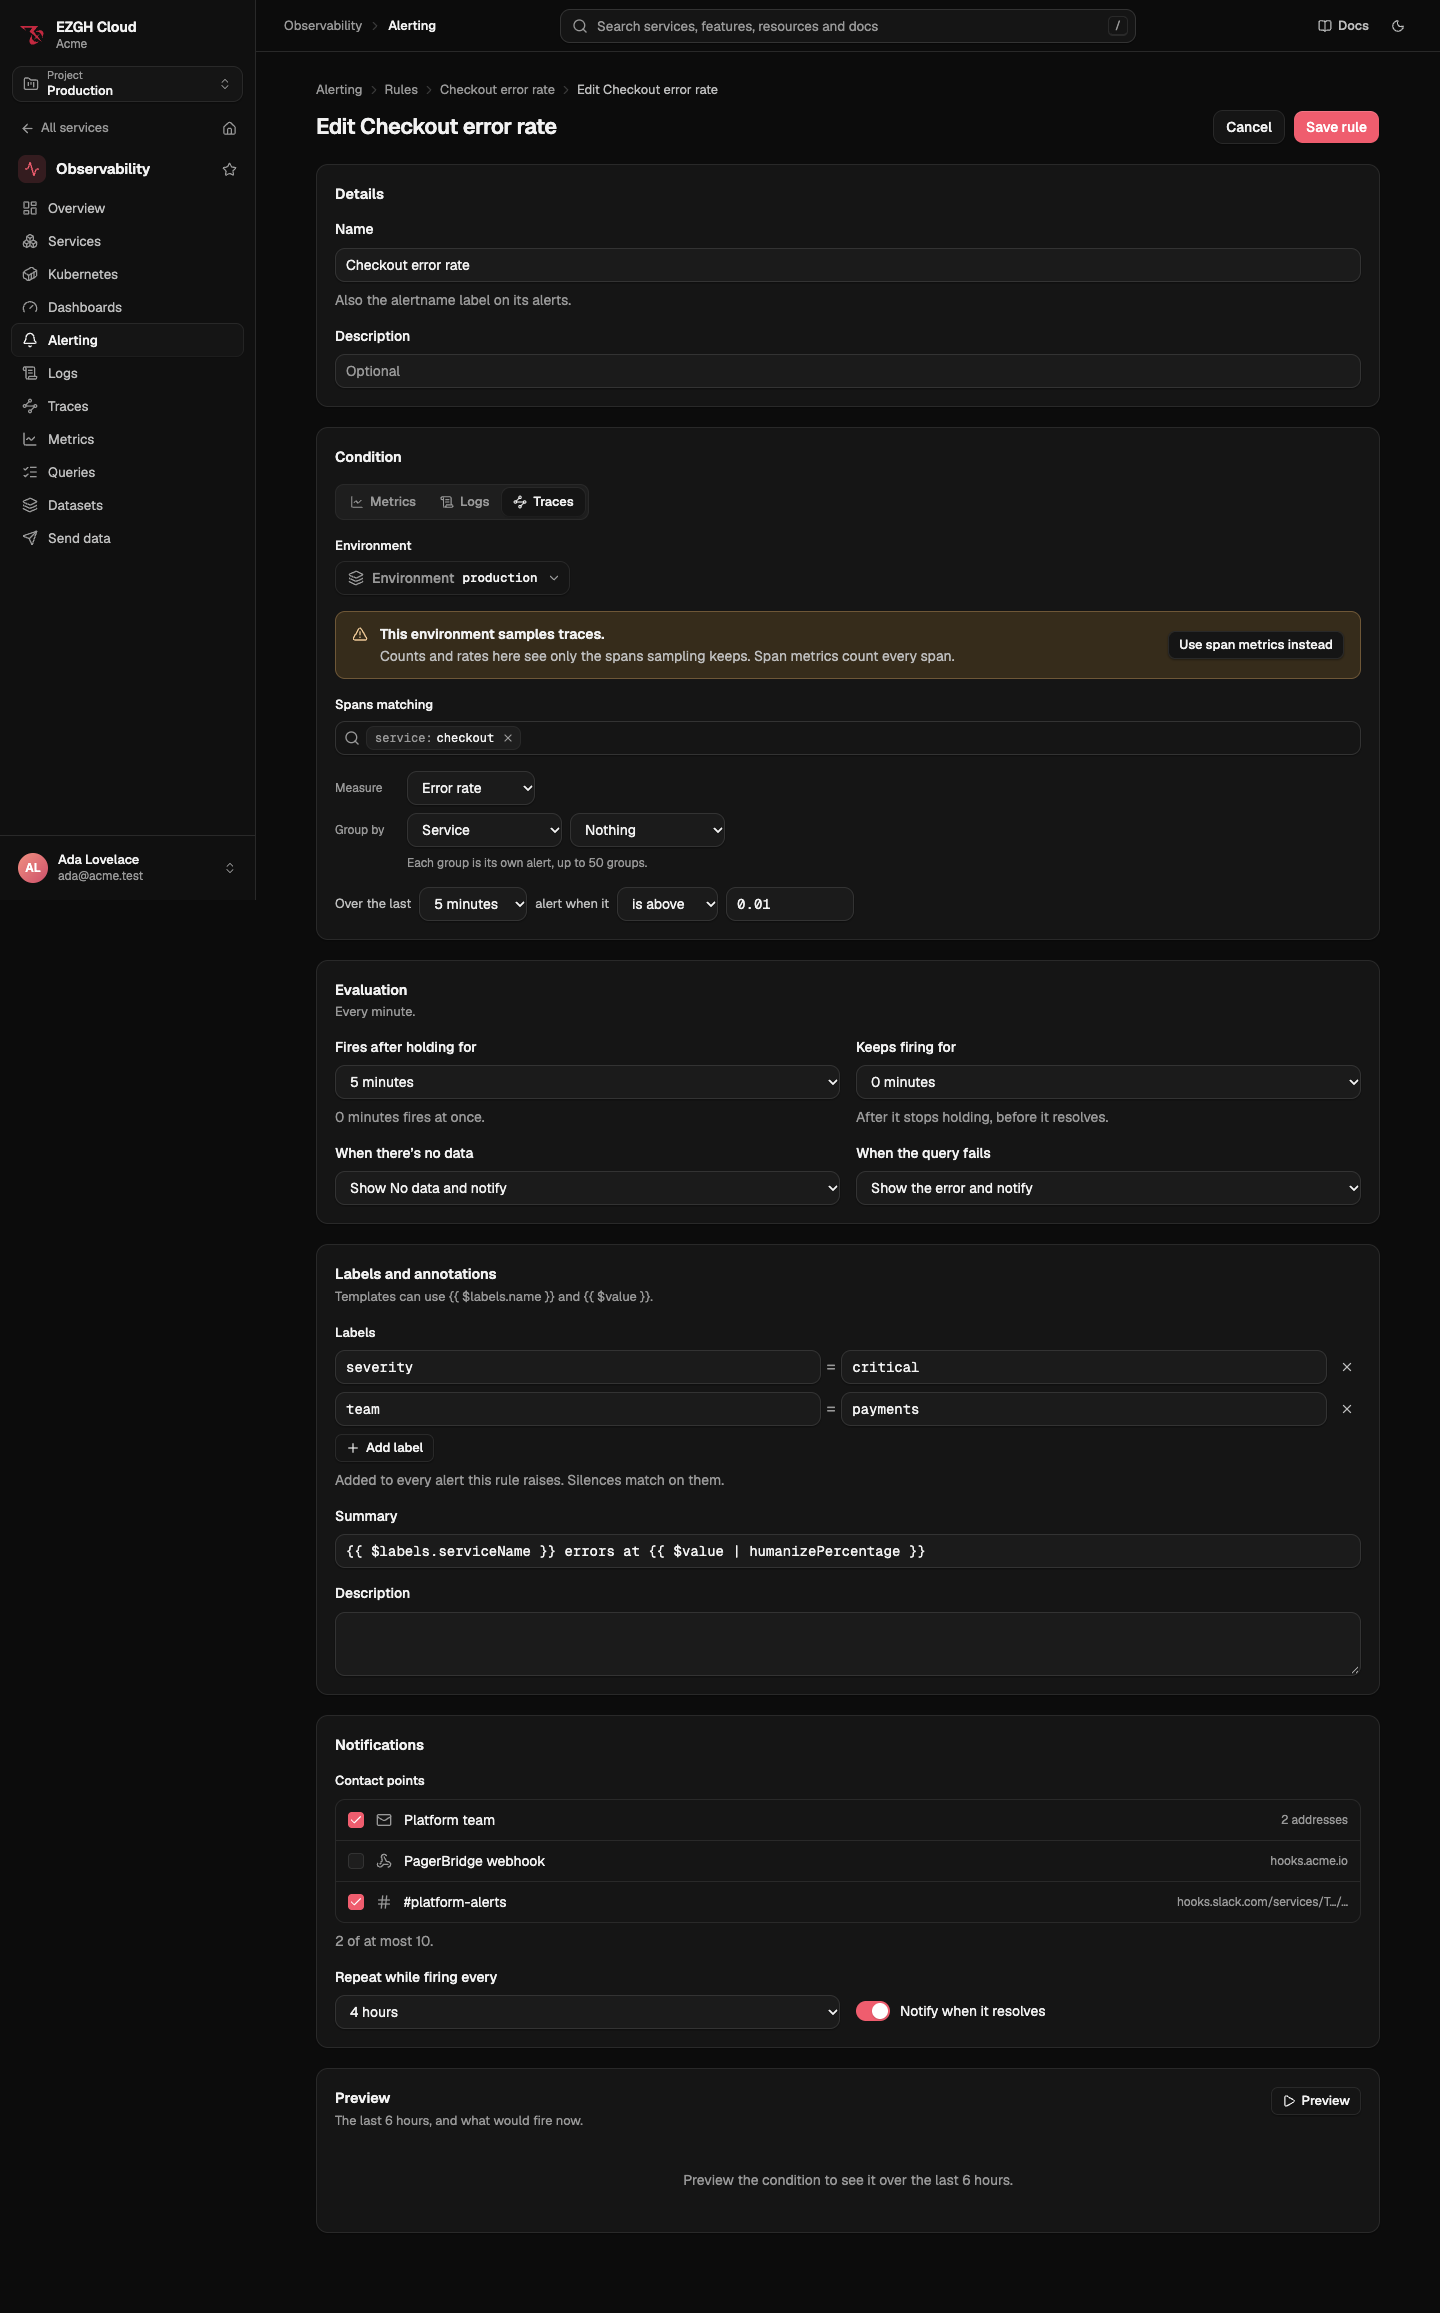
Open Observability > Alerting > Rules. The list filters by name, state, condition kind and contact point, and sorts by state, name or latest change. Create rule opens the editor: choose Metrics, Logs or Traces, then the condition (the logs and traces builder is the dashboard panels’), Fires after holding for, Keeps firing for, When there’s no data, When the query fails, labels, annotations, contact points, Repeat while firing every and Notify when it resolves. Preview charts the condition over the last 6 hours with its threshold and lists what would fire now.
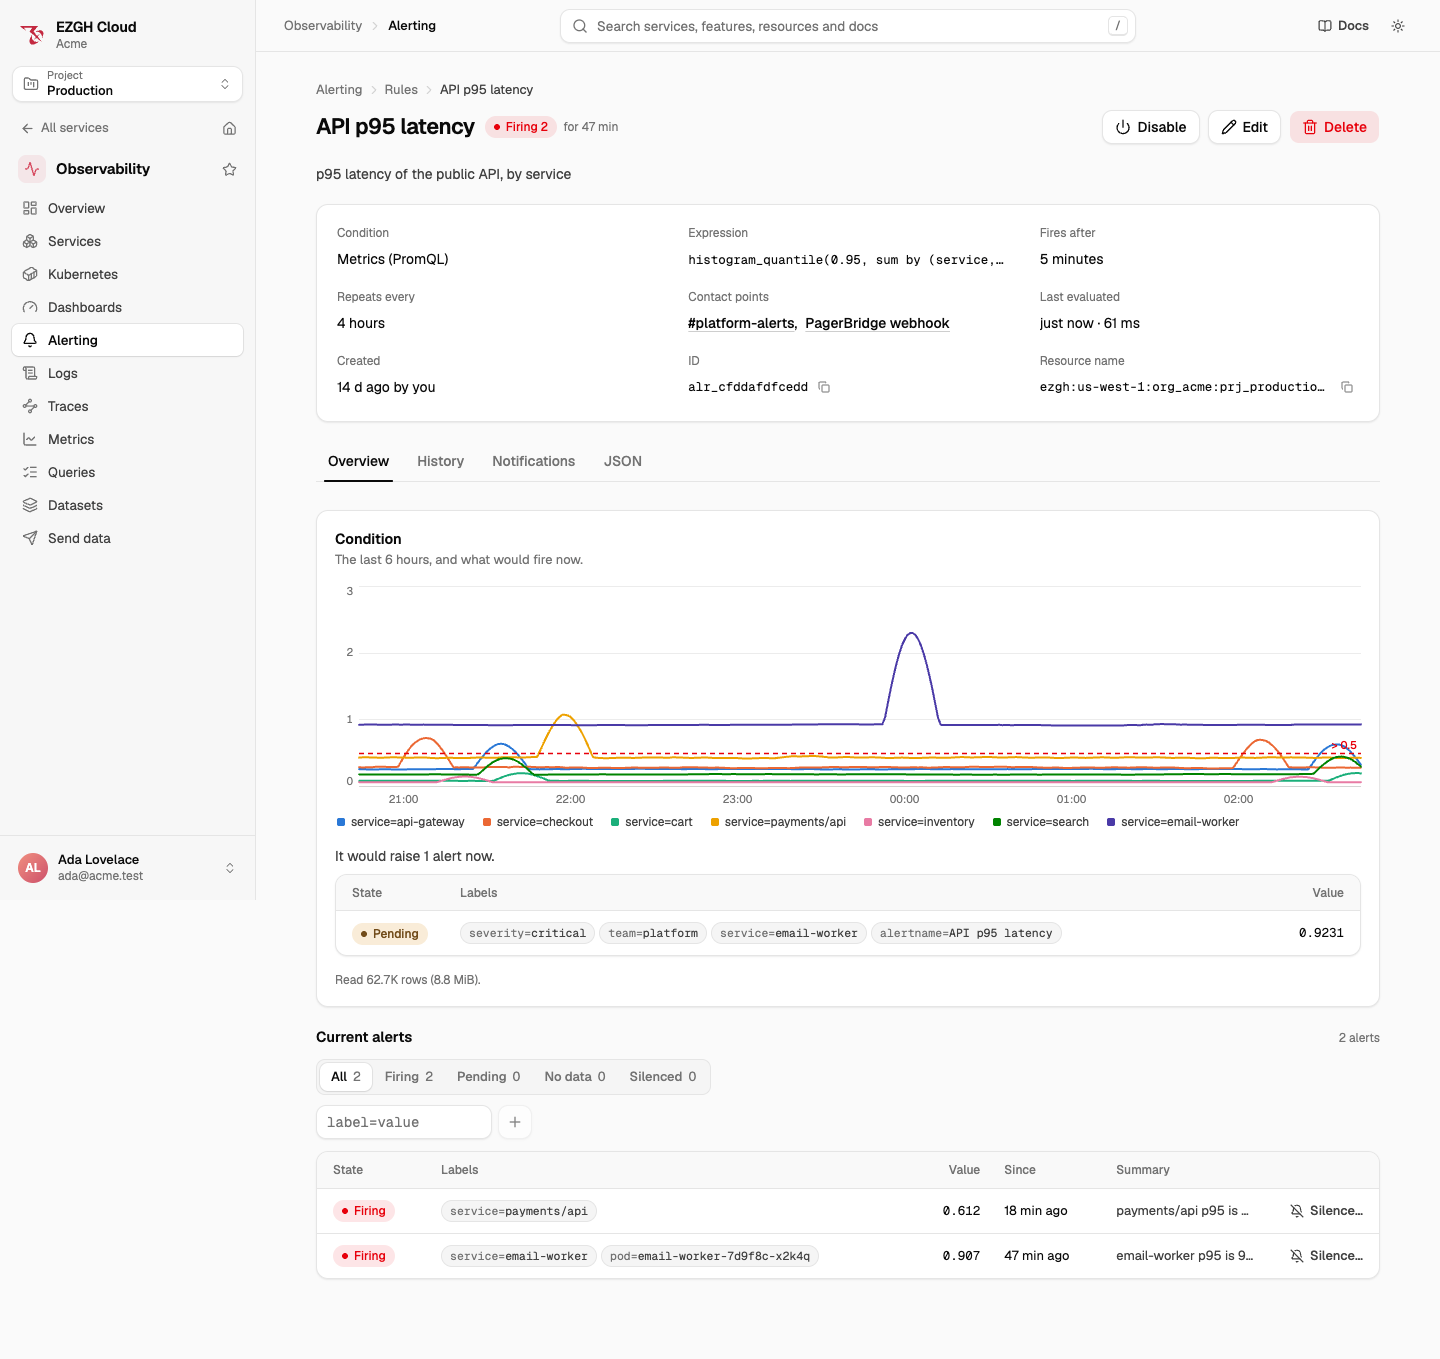
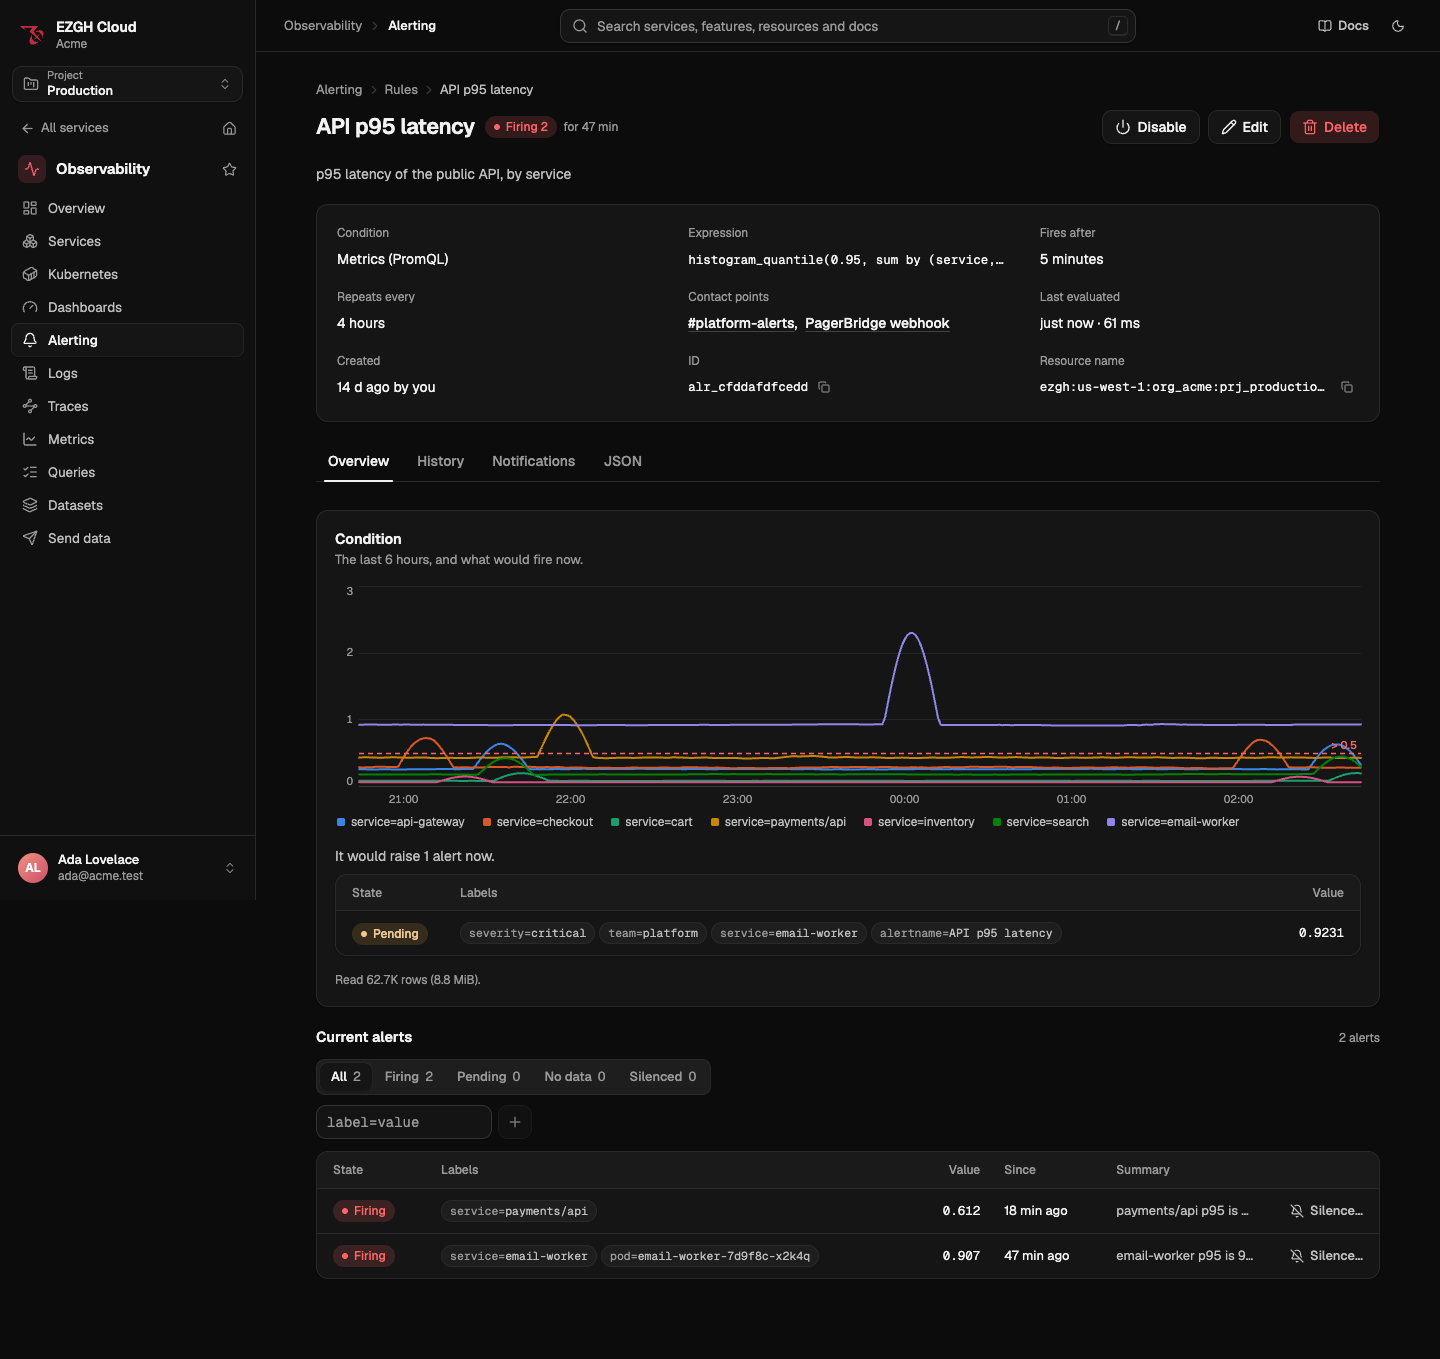
A rule’s page has Overview (the condition charted over 6 hours and its current alerts, with state and label filters), History (state changes for 30 days, filtered by instance, target state and time), Notifications (each notification with its delivery attempts) and JSON. Disable, Edit and Delete are at the top. If someone saved the rule after you opened it, saving offers to load their version or overwrite it.
From the CLI and the API
ezgh obs alert-rules test -f alerts/high-latency.json --project web
ezgh obs alert-rules apply -f alerts/high-latency.json --project web
ezgh obs alert-rules list --state firing,noData --sort changed --project web
ezgh obs alert-rules get "API p95 latency" -o json > rule.json
ezgh obs alert-rules delete "API p95 latency" --project web
ezgh obs alerts list --owner rule:"API p95 latency" --project webapplyupdates the rule the file’sidorslugnames, else the one with the file’snamewhen exactly one has it, and creates the rule when there’s none. An update replaces the fields the file has (the condition whole) and keeps the others. The output ofget -o jsoncan be applied as it is. Each problem is printed aspath: message.testevaluates the file once and saves nothing (--atfor another time).listfilters by--search,--state,--kind,--contact-pointand--label, and sorts with--sort state|name|changed. A state marked(delayed)is held because of an EZGH issue.
ezgh obs alert-rules and ezgh obs alerts list every flag.
Under /v1/organizations/<organization ID>/projects/<project ID>/obs/:
| Operation | Request |
|---|---|
| List rules | GET alert-rules |
| Create a rule | POST alert-rules |
| Get a rule | GET alert-rules/<rule ID> |
| Change a rule | PATCH alert-rules/<rule ID> |
| Delete a rule | DELETE alert-rules/<rule ID> |
| A rule’s history | GET alert-rules/<rule ID>/history |
| Preview a rule | POST alert-rules/test with { "rule": {…}, "time": "…" } (time optional, RFC 3339, not in the future) |
- A rule’s answer is its document with
id,slug,kind(promql,logsortraces),versionandstatus:state,stateSince, instancecounts,lastEvaluatedAt,lastDurationMs,erroranderrorSince,degradedanddegradedSince, andwarnings. Create and update answers also carry top-levelwarnings. GET alert-rulesfilters byq(part of the name),stateandkind(repeatable),contactPoint,label(name=value,name!=value,name=~reorname!~re, repeatable) andenabled, and sorts bysort=state(the default: firing, error, no data, pending, OK, disabled, then by name),nameorchanged.totalcounts the rules the filters keep.- History entries (
from,to,at, the instance’sfingerprintandlabels,value) are newest first, filtered byfingerprint,to(the target state), andfromanduntil(RFC 3339 times). An entry without a fingerprint is the rule’s own (entering or leaving error). GET alertslists current instances, filtered bystate,severity,label,owner=rule:<rule ID>andq;GET alerts/groupsgroups them by rule, as the Alerts page does. One request reads at most 20,000 instances: when the filters keep more,truncatedistrue, andtotaland the counts are lower bounds.
Rule limits are on Limits.