
Real user monitoring (RUM) measures your web applications as your users experience them. Add the EZGH browser SDK to a web app, and every page load, route change, interaction, network request, Core Web Vital and JavaScript error from real browsers arrives in your project’s Observability, as ordinary traces, logs and metrics in the app’s environment.
- Performance: LCP, INP, CLS, FCP and TTFB by route, browser, device and country.
- Errors as issues: symbolicated with your source maps, grouped into issues you resolve or ignore, and reopened when a newer release brings them back.
- One trace from click to database: when you allow it, requests to your APIs carry
traceparent, so the browser span and your backend’s spans are one trace. - Session timelines: from an error or a slow view, see that session’s views, interactions, requests and errors in order.
- Small and safe: the core SDK is under 25 KB gzipped, never breaks your page, stores no IP addresses and captures no page text.
- Billed as Observability data: browser data is billed as logs and traces ingested bytes, with no RUM-specific price. The Web Vitals, view, error and long-task metrics are generated by EZGH from your view events and errors, and are free, as span metrics are. Source maps, symbolication and issues cost nothing. Errors dropped by spike protection aren’t billed.
Quick start
Create a client token, add the SDK to your app, and see your first page loads.
Client tokens
The publishable credential your pages send with: environment, application, origins and limits.
Configuration
Every init option and function, tracing to your APIs, view names and beforeSend.
Source maps
Debug IDs, the build plugin, the CLI, and uploads from CI with no stored secret.
Tunnel
Send through your own domain so ad blockers don't drop the data, with ready-made handlers.
Privacy and consent
What's collected and what isn't, URL redaction, and waiting for consent.
Issues and alerts
How errors are grouped, resolved and reopened, and alerts on new issues.
Data reference
Every attribute, span, event and generated metric, with PromQL recipes.
Limits
Token limits, spike protection, request sizes, quotas and source-map storage.
Concepts
| Term | Meaning |
|---|---|
| Browser app | A web application sending RUM data, named by its application, such as storefront. The console groups client tokens by it; it isn’t a resource of its own. |
| Client token | A publishable credential (ezgh_ct_…) for one environment and application, with allowed origins and limits. It has an ID, a ctk_ slug and a resource name. See Client tokens. |
| Session | One user’s visit: a random ID shared across tabs of the same origin. It ends after 30 minutes of inactivity or 4 hours. |
| View | One page or route: a full page load or a single-page app’s route change, named by its route template, such as /users/:id. |
| Release | Your build’s version: release in init, stored as service.version. |
| Debug ID | A UUID linking a built JavaScript file to its source map. See Source maps. |
| Issue | One kind of error in one environment and application, with a state: unresolved, resolved or ignored. It has an ID, an iss_ slug and a resource name. See Issues and alerts. |
How it works
- The SDK sends OpenTelemetry (OTLP JSON) to
https://obs-browser.ezghcloud.com, or to your own tunnel. - EZGH checks the token, the page’s origin and the token’s limits; adds the country, region and city from the user’s IP address, then discards the address; and applies your dataset’s transform rules.
- Errors are symbolicated with your source maps and grouped into issues, usually within 30 seconds.
- EZGH generates the RUM metrics from view events and errors (browsers send no metrics). Everything is searchable as logs and traces, the metrics are in PromQL, and the RUM pages in the console read the same data.
Browser data goes to the dataset of the token’s environment and is kept by that dataset’s retention class, like any other logs and traces.
In the console
Open Observability. The Real user monitoring group has three pages:
-
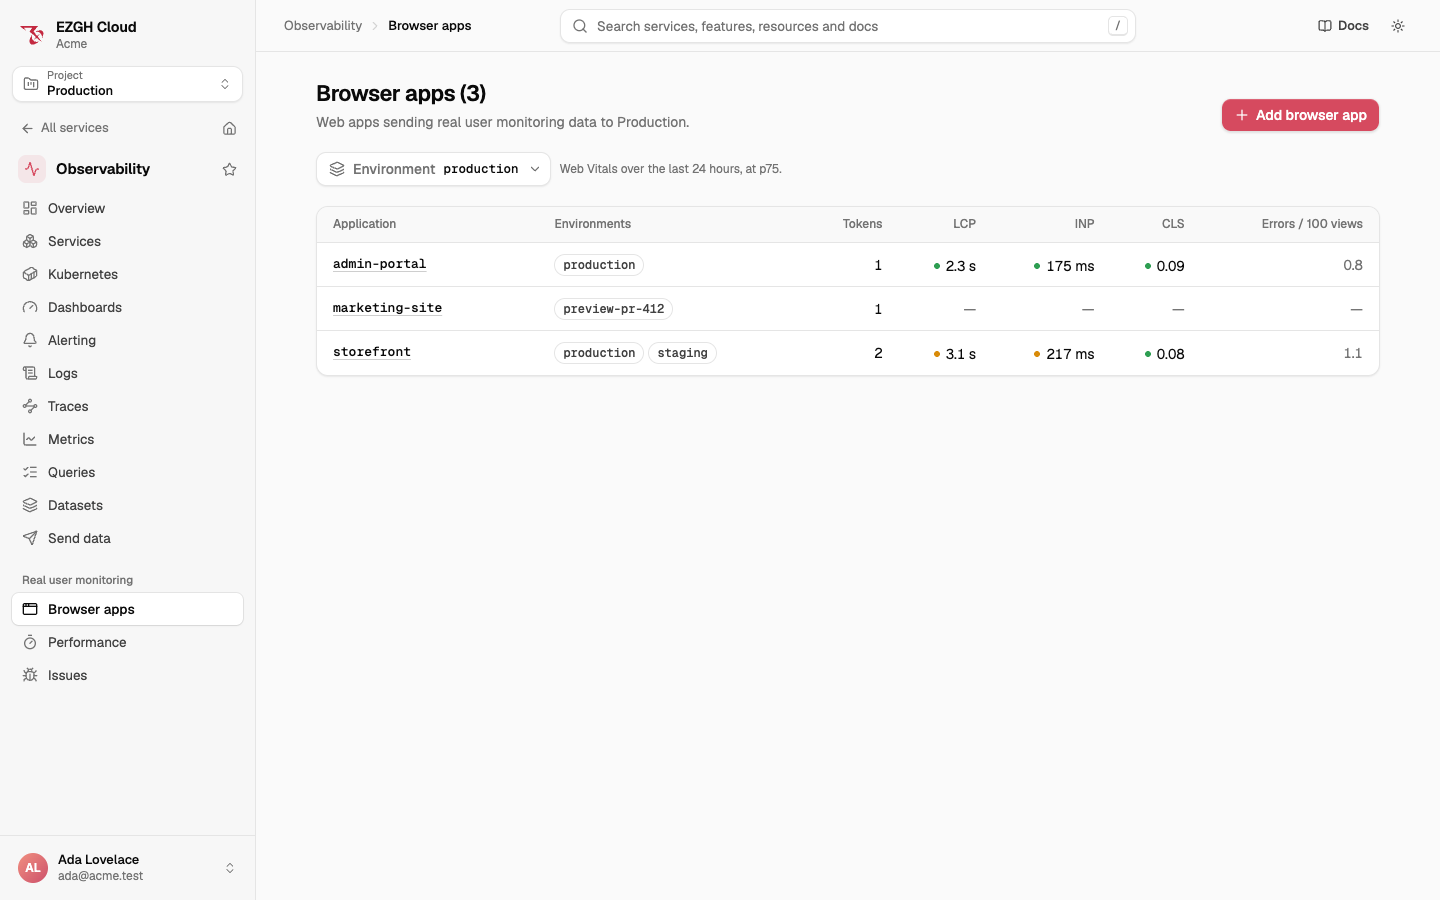
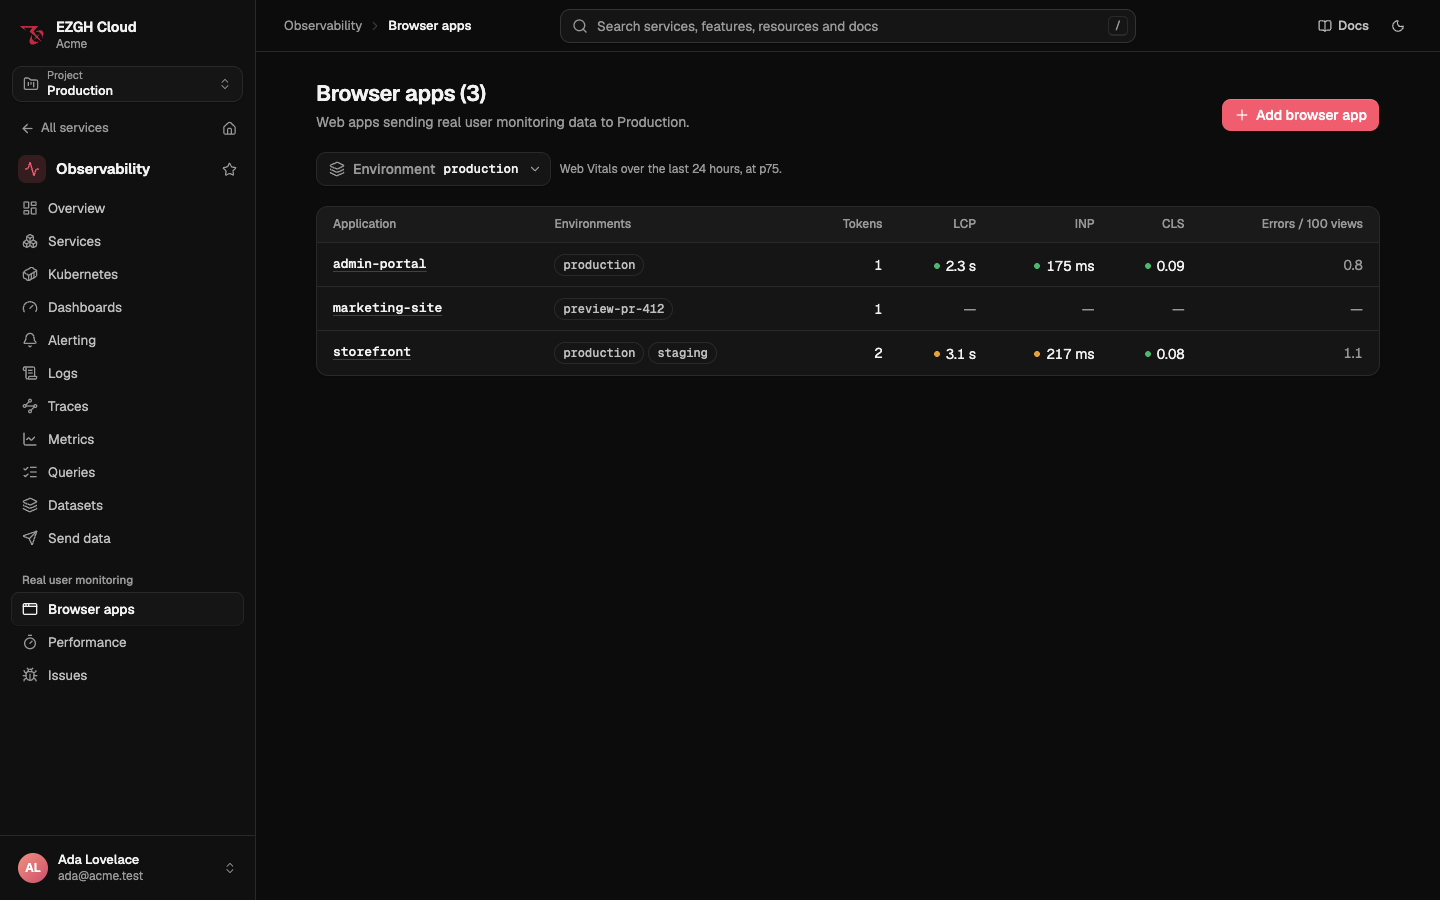
Browser apps: one row per application, with its environments, tokens and 24-hour p75 Web Vitals and error rate. Add browser app creates a client token, and each app has Overview, Tokens, Source maps and Setup tabs. Setup shows the install code for npm, React, Next.js, Vue, Angular and a script tag with the token filled in, the build plugin’s configuration with your organization’s and project’s IDs, and tunnel handlers.
-
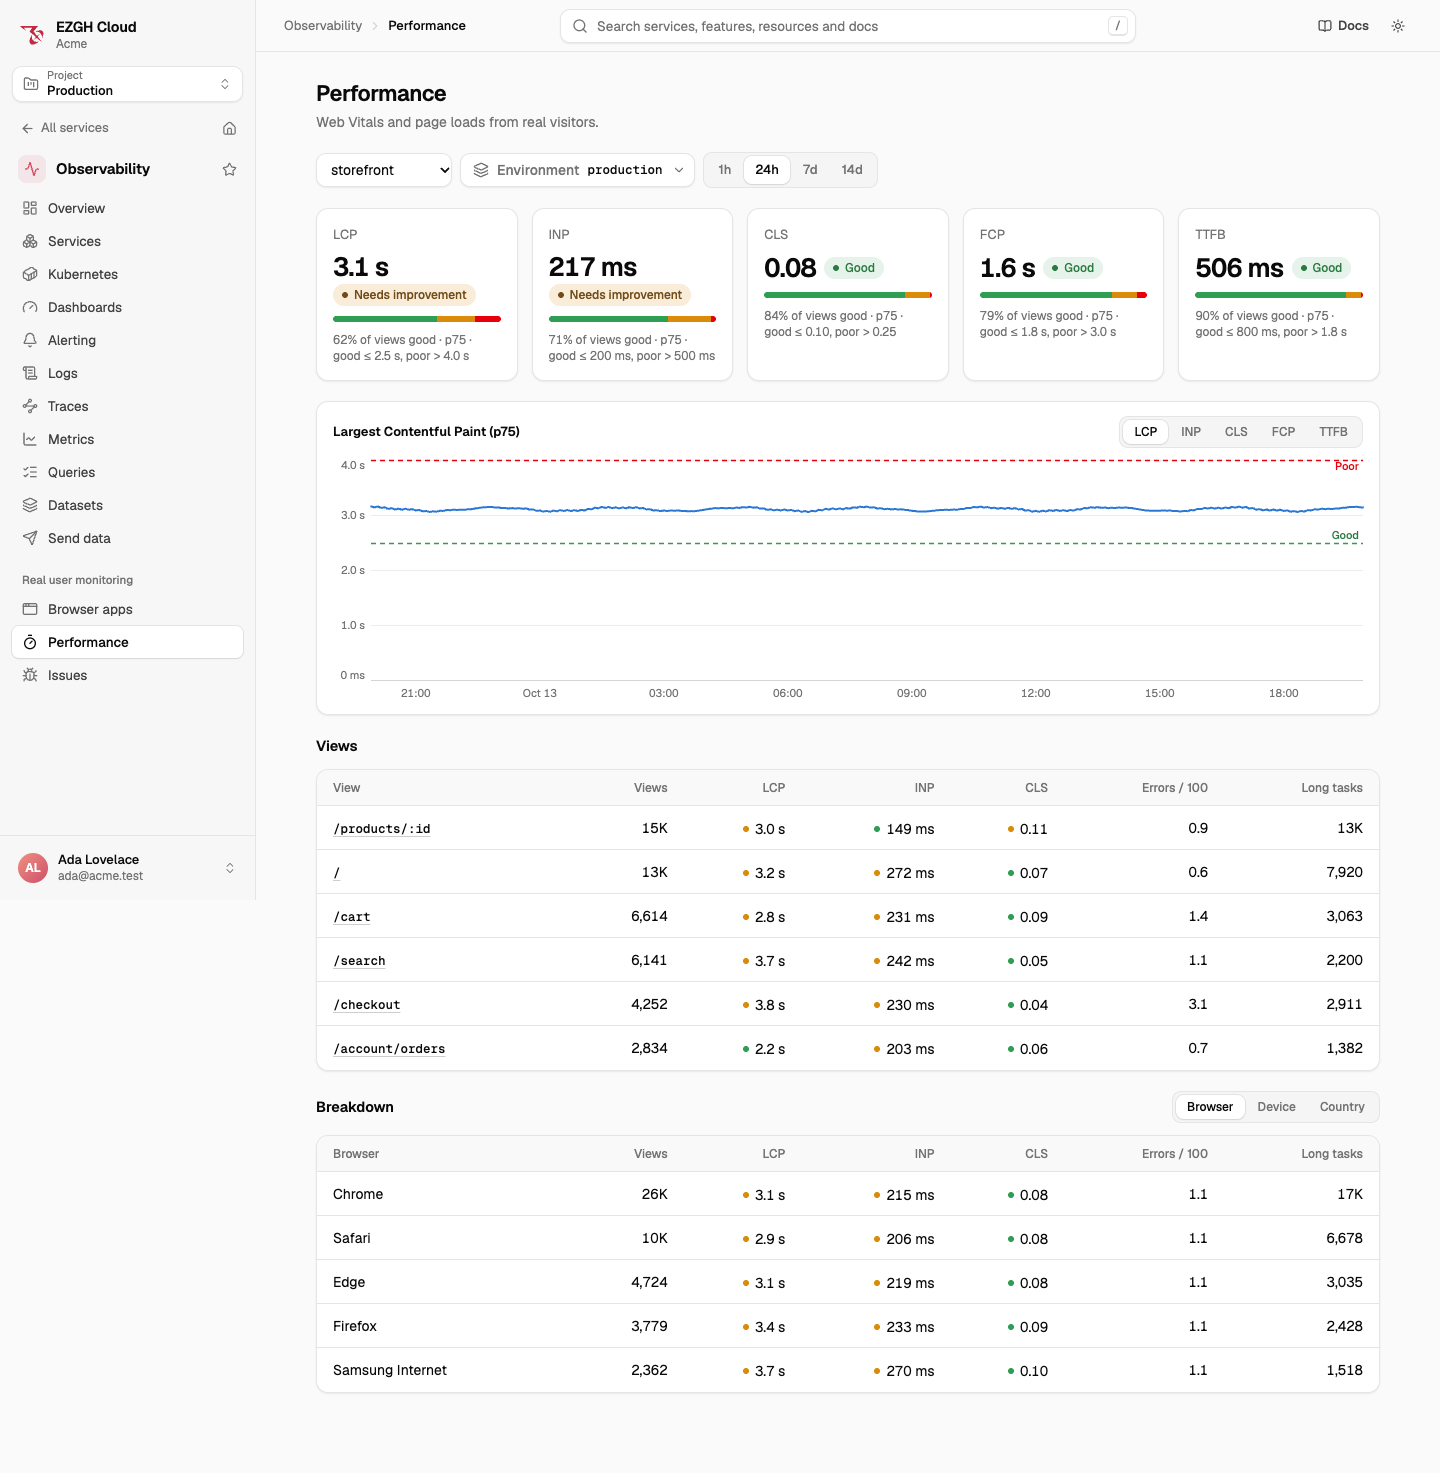
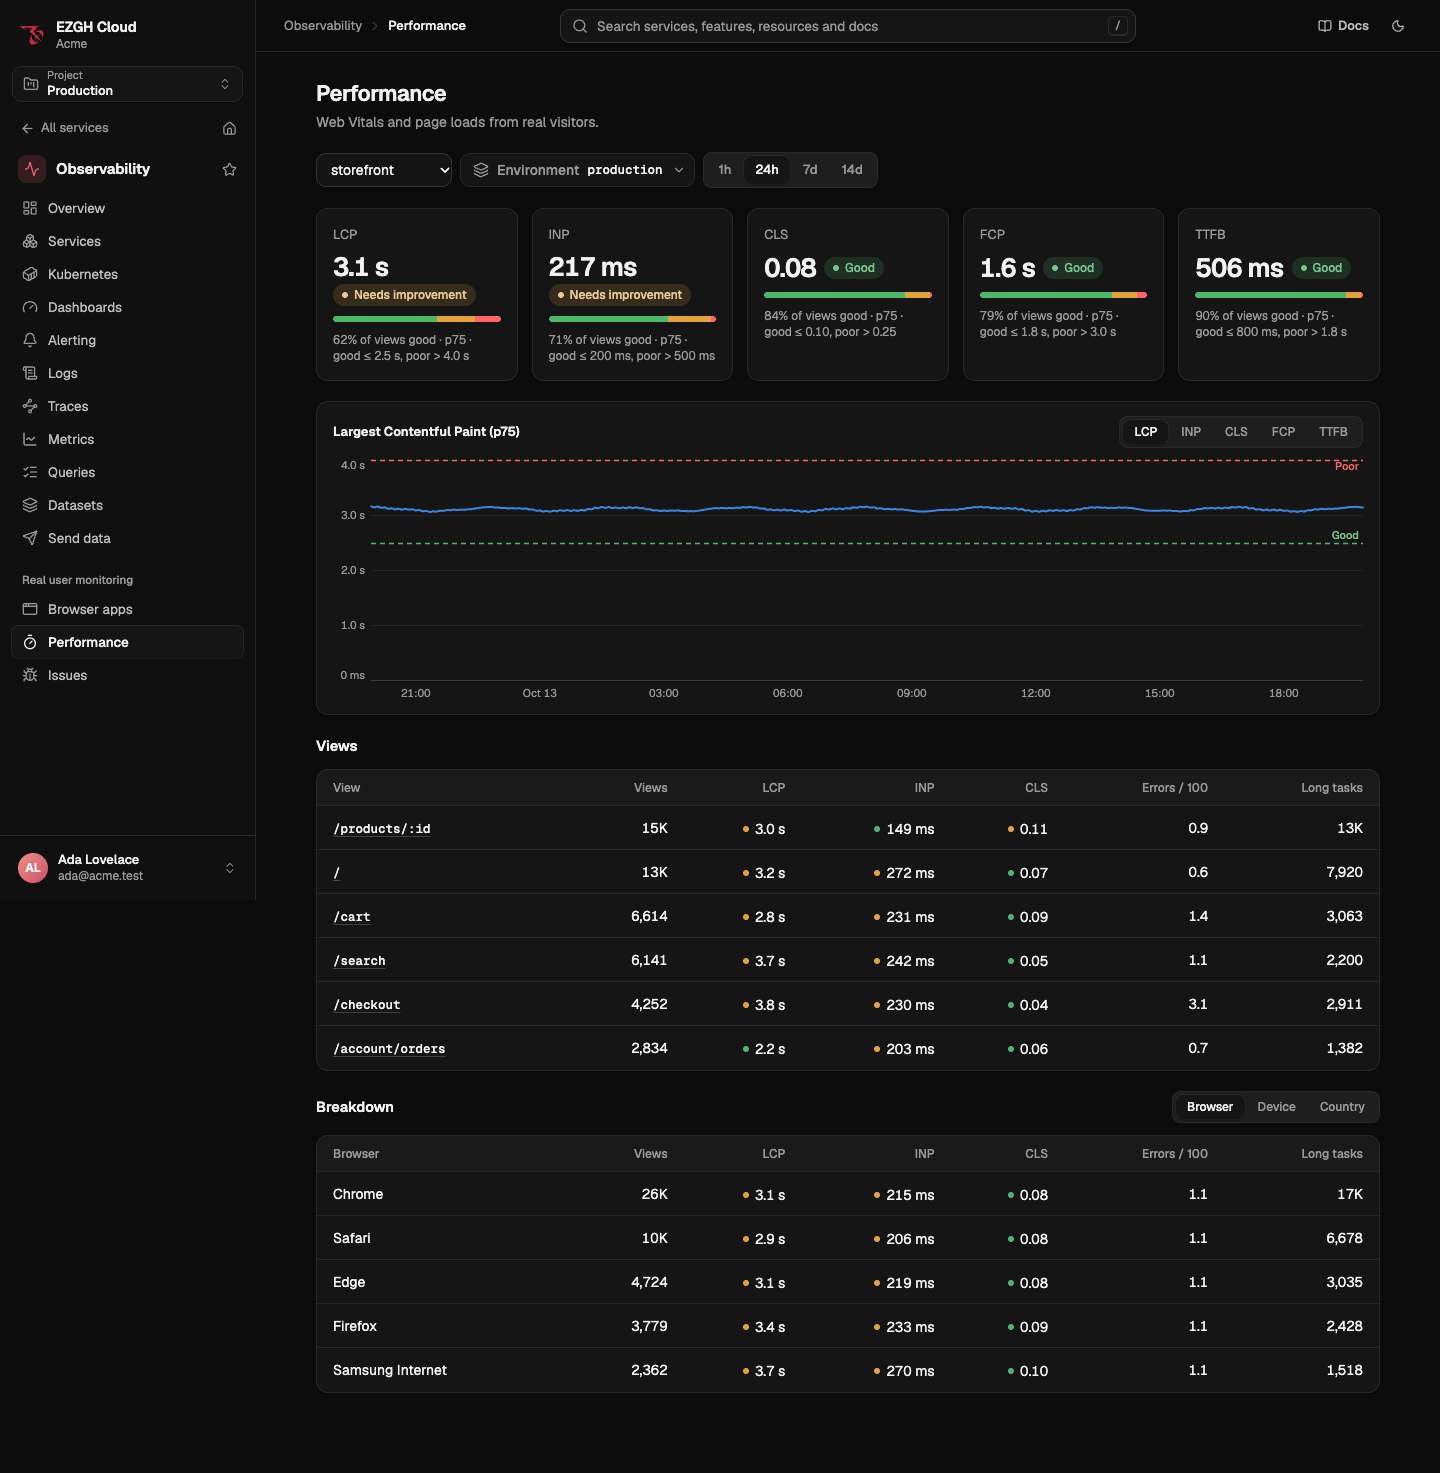
Performance: p75 Web Vitals with good, needs-improvement and poor bands, their trends, a table of views by route, and breakdowns by browser, device and country.
-
Issues: the issues of an environment, by state, with each issue’s stack trace, breadcrumbs, breakdowns, events and session timelines.
Without the actions to change client tokens, source maps or issues, their pages are read-only.
Access
| Action | Allows | Access level | Policies |
|---|---|---|---|
obs.clientTokens.list |
Listing client tokens | List | ObsFullAccess, ObsReadOnlyAccess, ReadOnlyAccess |
obs.clientTokens.get |
Viewing a client token, its value included | Read | ObsFullAccess, ObsReadOnlyAccess, ReadOnlyAccess |
obs.clientTokens.create |
Creating client tokens | Write | ObsFullAccess |
obs.clientTokens.update |
Changing a token’s name, origins, tunnel addresses and limits | Write | ObsFullAccess |
obs.clientTokens.delete |
Deleting client tokens | Write | ObsFullAccess |
obs.sourceMaps.upload |
Uploading source maps | Write | ObsFullAccess, ObsSourceMapUploadAccess |
obs.sourceMaps.list |
Listing uploaded releases and their files | List | ObsFullAccess, ObsReadOnlyAccess, ReadOnlyAccess, ObsSourceMapUploadAccess |
obs.sourceMaps.delete |
Deleting a release’s source maps | Write | ObsFullAccess |
obs.issues.list |
Listing a dataset’s issues | List | ObsFullAccess, ObsReadOnlyAccess, ReadOnlyAccess |
obs.issues.get |
Viewing an issue, its breakdowns and its events | Read | ObsFullAccess, ObsReadOnlyAccess, ReadOnlyAccess |
obs.issues.update |
Resolving, ignoring and reopening issues | Write | ObsFullAccess |
- Creating a token with an environment that has no dataset yet also needs
obs.datasets.create. - Every issue read and change also needs
obs.issues.liston the issue’s dataset, and an issue’s events needobs.logs.searchthere too: they’re log records. - A session timeline needs
obs.logs.searchandobs.traces.searchon the dataset. ObsSourceMapUploadAccessholds onlyobs.sourceMaps.uploadandobs.sourceMaps.list(withorganizations.get,projects.listandprojects.get): attach it to the bot your CI uses. See Source maps.
Trails
Creating, changing and deleting client tokens, uploading and deleting source maps, and changing an
issue’s state are recorded in Trails with eventSource obs.ezghcloud.com, and so are
the reads: CreateClientToken, UpdateClientToken, DeleteClientToken, GetClientToken,
ListClientTokens, UploadSourceMaps, ListSourceMaps, DeleteSourceMaps, ListIssues,
GetIssue and UpdateIssue.
- A token’s value never appears in Trails. Token events record its name, dataset, application and how many origins it has; source-map uploads, the application, release and file count; issue changes, the new state.
- Source-map chunk uploads are recorded only when they’re refused (
CheckSourceMapChunks,UploadSourceMapChunk): the commit,UploadSourceMaps, records the upload. - Data sent from browsers, issue breakdowns, issue events and session timelines aren’t recorded.